In 2020 we all were inside our home trying to work from home or study from home. We all came up with our own activities, ways to have fun within the boundaries of our home. So this blog post kinds of analyzing all the activities that I did.
tl;dr - I didn’t do anything special, just had a lot of data of all the activities that I did so I have generated some graphs.
index
- BugBounty - A look back at the first few months of my bug-bounty
- Health & Fitness - Analysis of my data from MiBand and Google Fit
- Chess - Played quite a lot of chess this year so a look back at the openings wins/losses.
- Music - Some really good music was released in 2020 and I spent listening to some old songs, cause why not?
- Movies & TV Shows - This year sucked for movies.
BugBounty
So I started what every “infosec enthusiast” seems to be doing these days, BugBounty. If you don’t know what BugBounty is then don’t worry you aren’t missing out on anything but if you are interested then in simpler words,
a reward offered to a person who identifies an error or vulnerability in a computer program or system.
For more details, you can read this wiki page
June 2020 was the month when I decided to get into bug bounties before that I was spending most of my time working on Google Summer of Code and making and breaking VM on Vulnhub and HackTheBox. There were several reasons for me to get into bug-bounty, some of them were as follows:
- Money - Obviously, I mean most the people who are starting in bug-bounty are doing it for money. And it tends to pay really well(if you are good at it)
- At that time(June 2020) I was in the 6th semester of my Bachelor’s so I thought having
Hall of Fame in XYZon my resume would look good and increase my chances of landing a good security/research-related job.
Anyway, here are some stats about my BugBounty journey:
Date of starting: June 16, 2020 – This was the day I submitted my first report on HackerOne. It was an
open redirectbut marked asNAcause the domain was out of scope. That day I learned that there is something calledscope.First Valid Bug: P2 on a VDP, on Bugcrowd - August 14,2020. tweet
First Bounty: September 16,2020 - 150 USD on a public program on HackerOne. tweet
First big bounty: October 15th,2020 - 1000 USD From Github. You can read my blog post about the bug.
Total Bounty earned in 2020: $3250(Bugcrowd+HackerOne)
Total Report submitted: 44(On Bugcrowd), 60(HackerOne)
Total valid reports: 4(On Bugcrowd), 20(HackerOne)
Total Duplicate reports: 18(On Bugcrowd), 21(HackerOne)
Almost all my valid paid bugs were found in the Android Applications. I didn’t spend much time on “web” related targets(Maybe in 2021). Even though I started in June 2020 I didn’t really focus on BugBounty until the end of August 2020, because from June to Mid-August I was working as a student dev for The Honeynet Project.
At this point, I would really like to thank @b3nac for always helping me out whenever I needed it, @bagipro for those amazing disclosed reports they helped a lot in learning new stuff. And @theart42 for always being there for discussion and special thanks for all the help with Frida. Without any of you guys, I don’t think I could have learned anything about Android BugBounty
Health & Fitness
I am no Gym freak or anything. I mostly take long walks at night just to cover the number of steps(as suggested by everyone). I own a Mi Band so I use it to track my sleep and the number of steps taken in a day.

This is the heatmap of my step counts. You can see that at the starting of the year I didn’t walk much even though I was doing the “normal stuff” like going to college etc once lockdown started I had taken more walks than usual. I had the target of hitting 5000 steps every day and I think most of the days I had achieved that.

This is the heatmap for my sleep time and before you think “why in a hell I haven’t slept since November?” I just want to say those blanks are because I broke the Mi Band and that’s when sleep tracking stopped. On Average, I slept around 7-8 hours a day(good for me 😄).
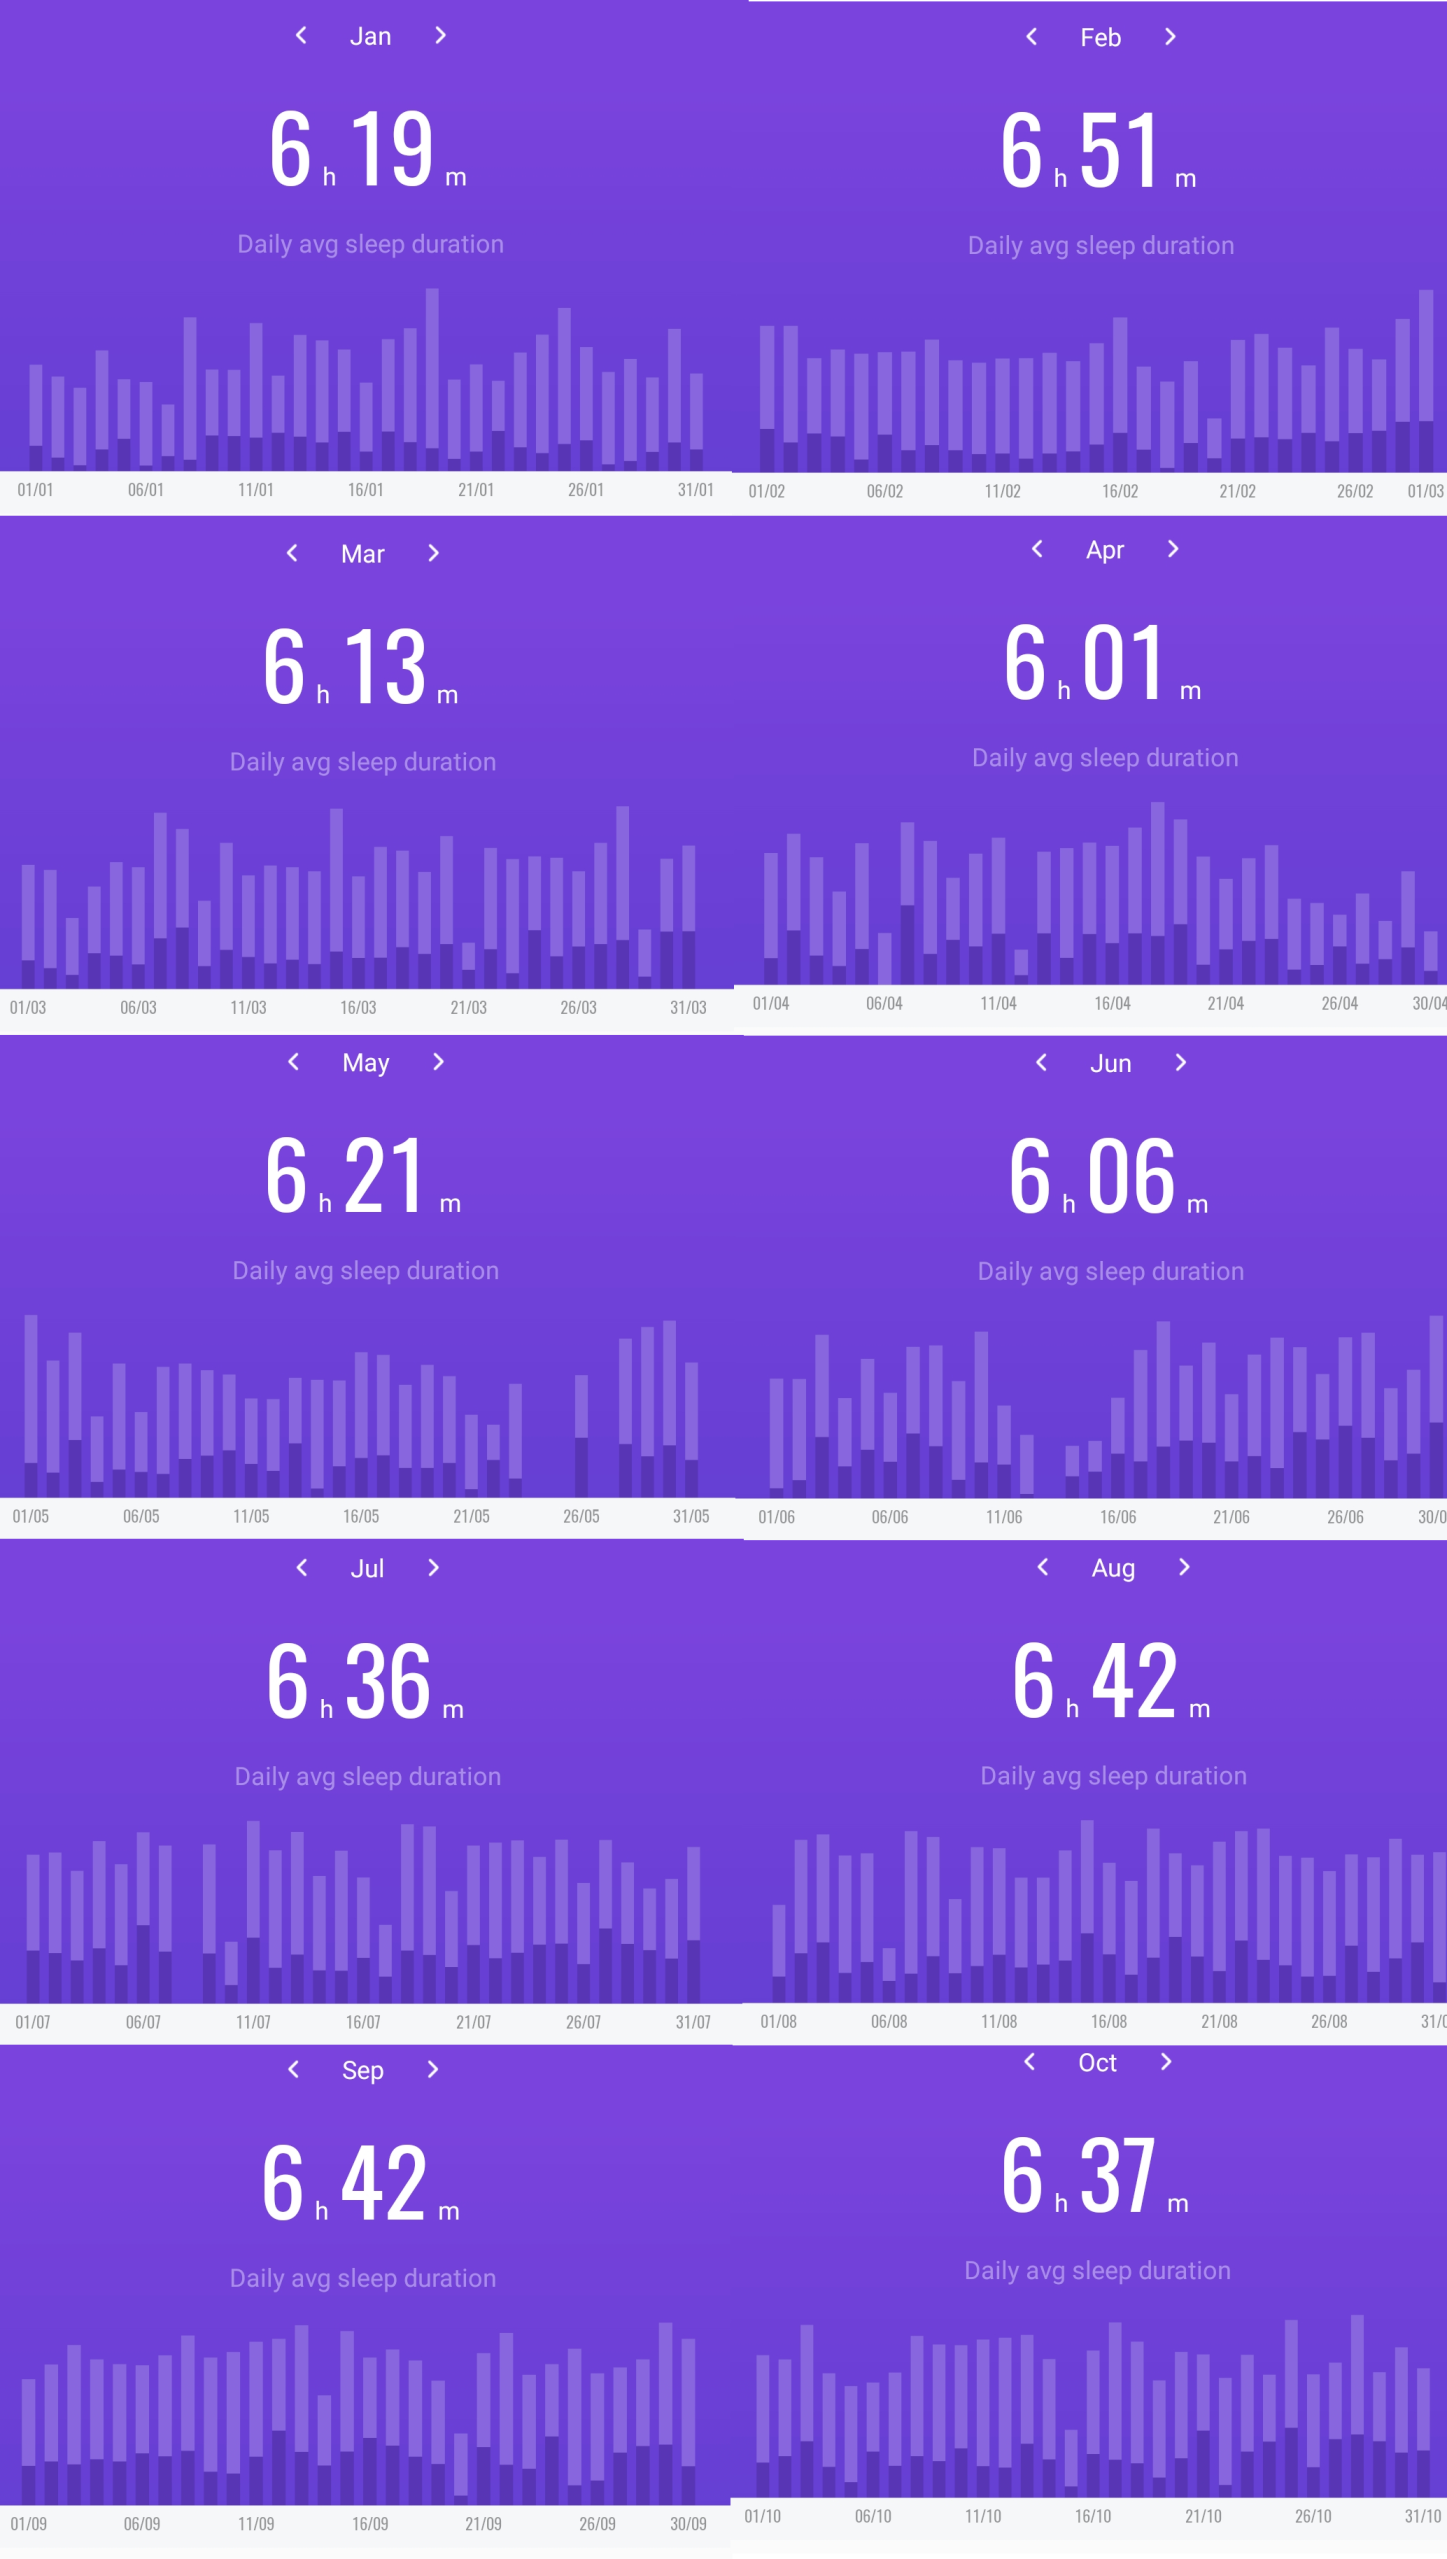
These graphs were exported from the MiFit Android app. The average sleep of ~6 hours seems legit. I remember on some days I slept for almost 10-11 hours and on a few days, I slept even less than 4 hours.
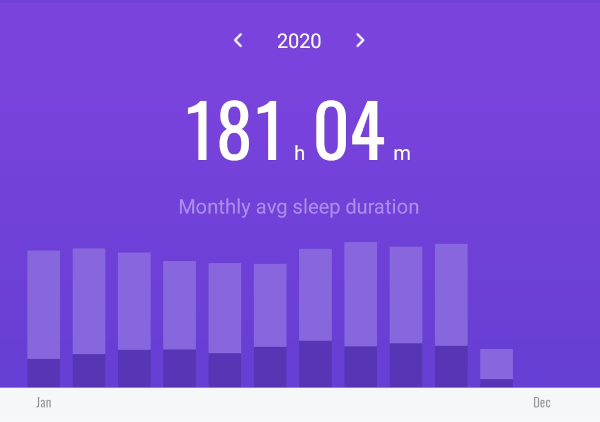
In the month there are around 730 hours and out of those I spent approx 181 hours sleeping. 😐
Chess
I spent quite a lot of time playing chess this year. I even bought the platinum membership of chess.com on a yearly discount. Now before we go on to see some yearly stats I want to clear one thing, if you want to play chess and don’t want to pay for any service then use lichess.org because the Free tier of Chess.com sucks. If you are willing to pay for it then the both platinum as well as diamond membership of chess.com are really amazing.
Ok, coming back to “my chess”, Even though I am not a high-rated player I spend most of my time playing bullet games(short and fun.)
In total, I have played around 474 games on lichess(some played in 2019) and 3,366 on chess.com
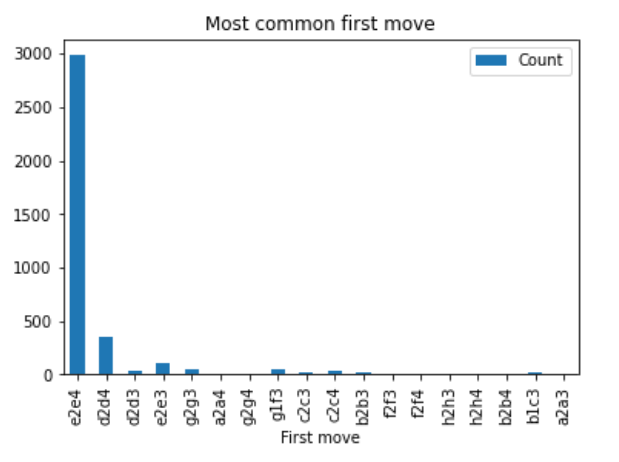
In a bullet game, you don’t try new things you try to go with the ones you know and that is why it seems that in almost all the games I play e2-e4 line.
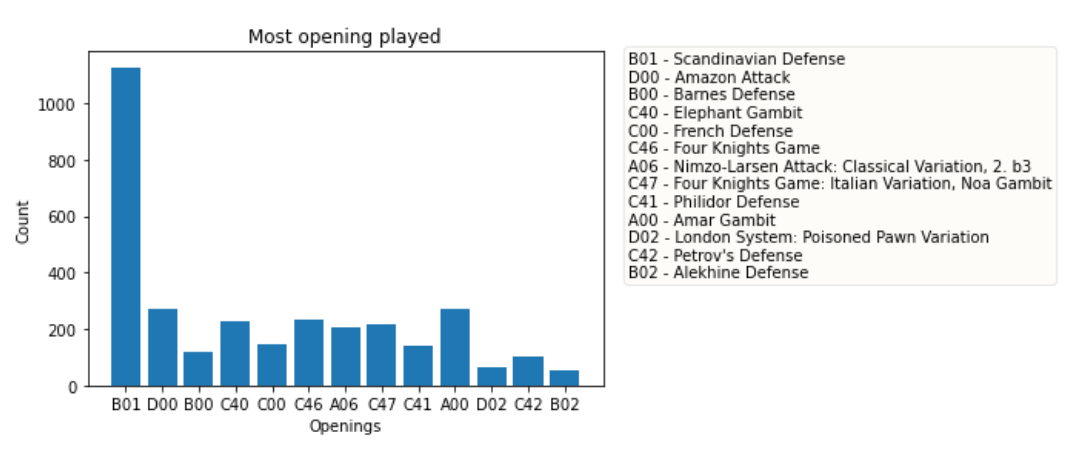
I am a huge fan of John Bartholomew and that is the reason I play Scandi in most of my games. Even though it’s not the best opening for beginners but I kind of loves it. Actually one of the main reasons to play this(Scandinavian) is because in this opening there are various possibilities of exchanging the queen early in the game and once queens are off the board then I feel kind of more comfortable playing the rest of the game.
For some reason Amazon Attack is in the second place even though I have zero clues what exactly Amazon attack opening is 😄
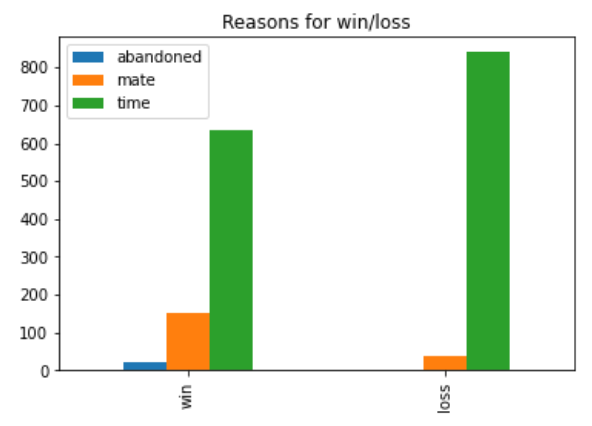
Obviously, time is a major factor in a bullet game so I guess this graph totally makes sense. But I am kind of proud that I have won more games from checkmate as compare to the losses

These are games played per day. I thought I played a lot but this graph says something different. Looks like I didn’t played(at all) in the starting of the year then toward the end I kind of went crazy on it. Like in august there are few days where I have played more than 40 games in a day. I think that’s the time when I was just doing GSoC work and not doing much in my day.
Music
I use last.fm to track my music. First I thought I’d export my data from that website and will write some code for it but then last.fm decided to help me out and generated almost all the stats all by themselves(Not a VIP feature).
All of these stats were generated by the website, I didn’t write any code for it.

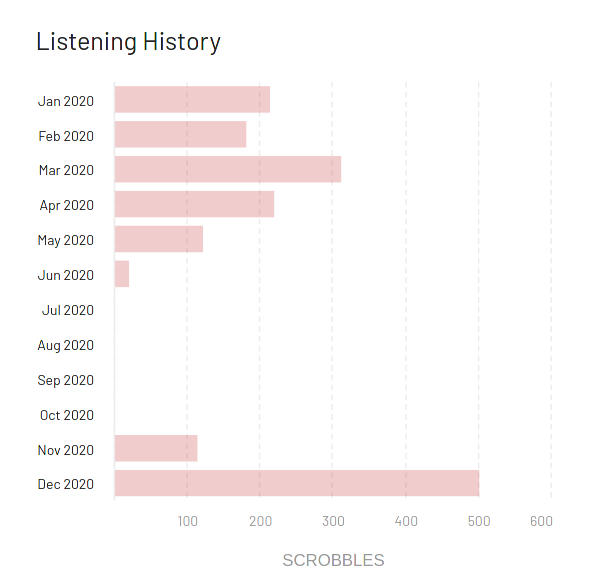
It’s a bit weird that I didn’t listen to any music for almost 3 months, I am not sure why but it is actually true I mean it’s not like data is missing or any other technical difficulty it just I didn’t listen to anything at all.
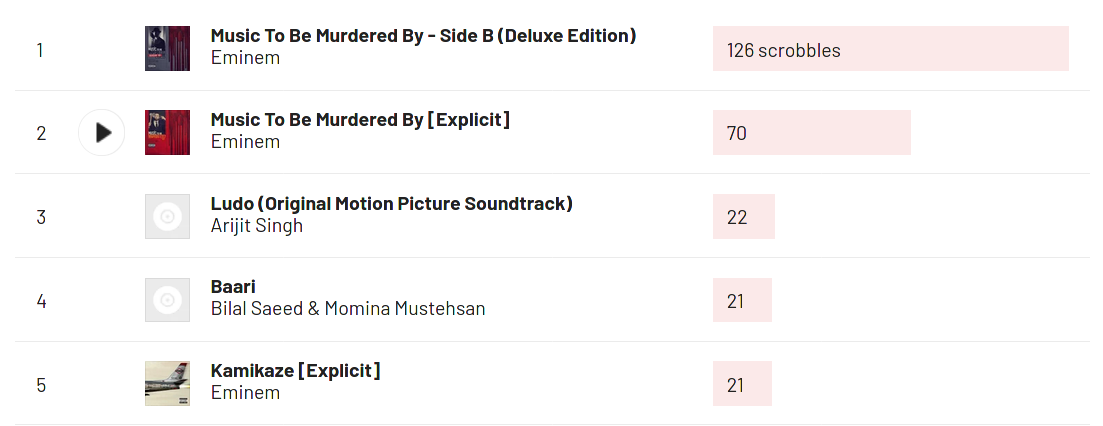
Three of the top 5 album spots are taken by Eminem. I really enjoyed MTBMB - Side B I mean it was completely unexpected since the MTBMB came just the previous year and rarely artist drop 3 albums in almost 2 years so initially, I thought there will be just 1-2 extra tracks. But I was completely wrong. There were almost 10-11 extra tracks and each one of those was insane. The one that I listened to the most was Killer
One thing that I absolutely loved in the lastfm stats was the listening clock.

This kind of shows at what time of the day I listened more music. As you can see I listened to more songs during the night time. It probably because I preferred listening to podcasts more in the morning(no I don’t have any data regarding my podcasts 😢)
Movies & T.V shows
I use trakt.tv for keeping track of all the movies that I watch. I just want to point out that this is a really good website if you just want something to keep a track of what you watched. But trakt.tv sucks at the developer level i.e their API. I mean you can’t export your data from their website if you are not a VIP user. Also, you can’t buy monthly VIP it has to be paid upfront for a year. And this is not just the case with the interface even with the API they don’t show information like runtime or genre of a show/movie.
To perform any analysis I had to use trakt/export_data.py and then use the imdbPy package to get some more information about the show/movie.
Anyway, let’s see a small analysis of my trakt data.
So in 2020, I spent 149 hours on movies and 498 hours watching TV shows. That is approximately 26.95 days 😱😱
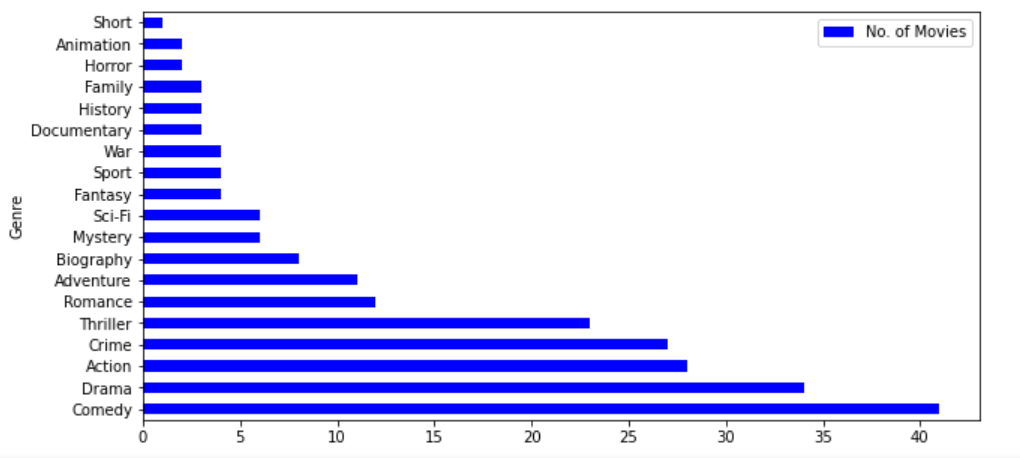
Taking a look at the movie genres, I think a lot of dramas are also listed as comedy on IMDb that is the reason comedy is on top. I expected the crime genre to be on the top because this year I was interested in crime related stuff more 👀.
This year kind of sucked when it came on “something to watch”. I mean there wasn’t any great movies released this year. Almost all the movies were “meh”.
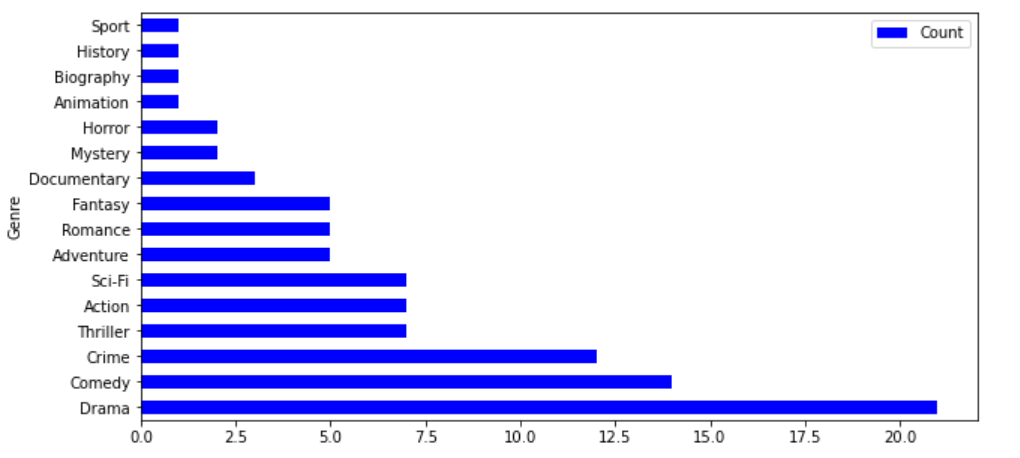
Looking at the TV shows I think most of the shows that I watched were the standup special of people like Kevin Hart, Dave Chapelle, Vir Das, etc. I think in above graph the Drama genre is on top cause I watched shows like You and Suits(cause of their popularity and because I didn’t have anything else to watch 😂).

The interesting thing to notice in this heatmap is that toward the end I watched loads of episodes (I think I was watching suits). Another interesting thing to notice is the gap, for a few days I continuously watched something(probably binging a show) and once I was done with that show I stopped watching anything for a while. This basically shows that I binge watch all the TV shows(maybe everyone does that). That dark green spot that you see around October that is for the The Queen's Gambit I binged all 7 episodes (6 hr 33 min) in a single day 😁
Conclusion
This year was good and bad for a lot of reasons. Some good things that happened this year were:
- I passed my 6th semester without writing any exams.
- I Didn’t have to go to college.
- Got started with BugBounty and got Hall of Fame in a few big companies.
- Got my eJPT certificate.
Some bad things that….you know what let’s not things about those :)
If you’d like to play with your own data and do something similar then check out my year-in-review repository which has code for getting your data and generating the graph.
Thanks for reading, Feedback is always appreciated.
You can follow me on @0xmzfr.