This is another one of that year in review posts where I pretend to write some python code and act as a data scientist. This year one thing that I really wanted was to use a library that would make my charts look a bit more clear and nice. Because let’s be real even though matplotlib and panda do the job those graphs aren’t appealing to anyone.
For that reason only I decided to use pyecharts. I think using this library was a great idea because the charts turned out to be pretty amazing.
Sleep & Fitness
No matter what happens my sleep always stays up. In 2022, my average monthly sleep went up a bit

I have no explanation for this because I have no idea how this happened. But I think I am happy about it, good sleep is a sign of a healthy body 💪
Articles and Book
Towards the end of the year, I decided to move from Goodread to Storygraph. I think the reason was that I was trying to add a review and for some reason, Goodreads website wouldn’t let me edit the dates. So I was like, I’m done with this, and found out about storygraph(via Reddit). I am not gonna lie, it’s maybe because I’m used to it or whatever but I found some of the Goodread UI much better than storygraph’s but in sense of functionality both are pretty much similar. I did find the “stats” section of storygraph more interesting, makes it easier for end year review :)
I read 30 books this year, and my goal was to read 40 since I already had read around 30 books in 2021.
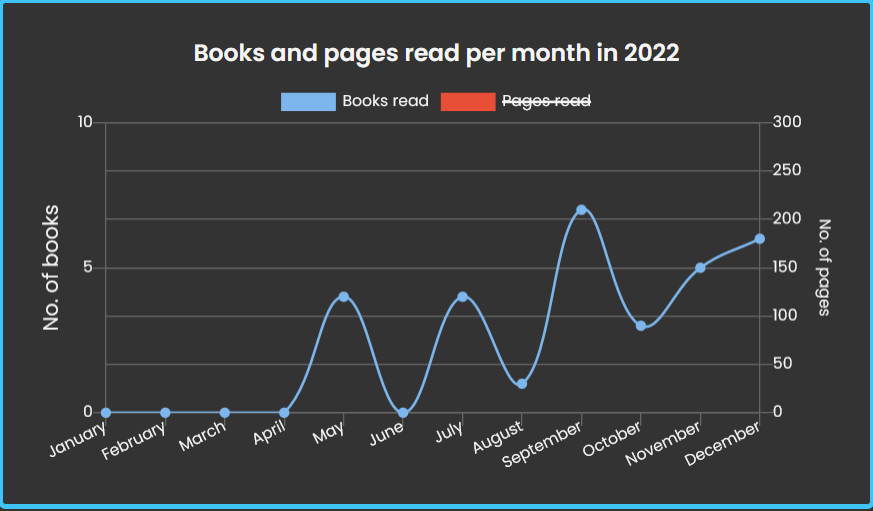
You can see I didn’t read anything in the first few months and then in order to hit the goal I went a bit berserk. One thing I learned this year was that instead of having like a big “40 books a year” goal, it would be better to break that big goal down in a short time frame which helps me track it better. So this year I have thought of reading 10 books every Quarter (40 books a year).
I didn’t read many articles this year or you can say I did read them just didn’t use my pocket much to keep track of them.
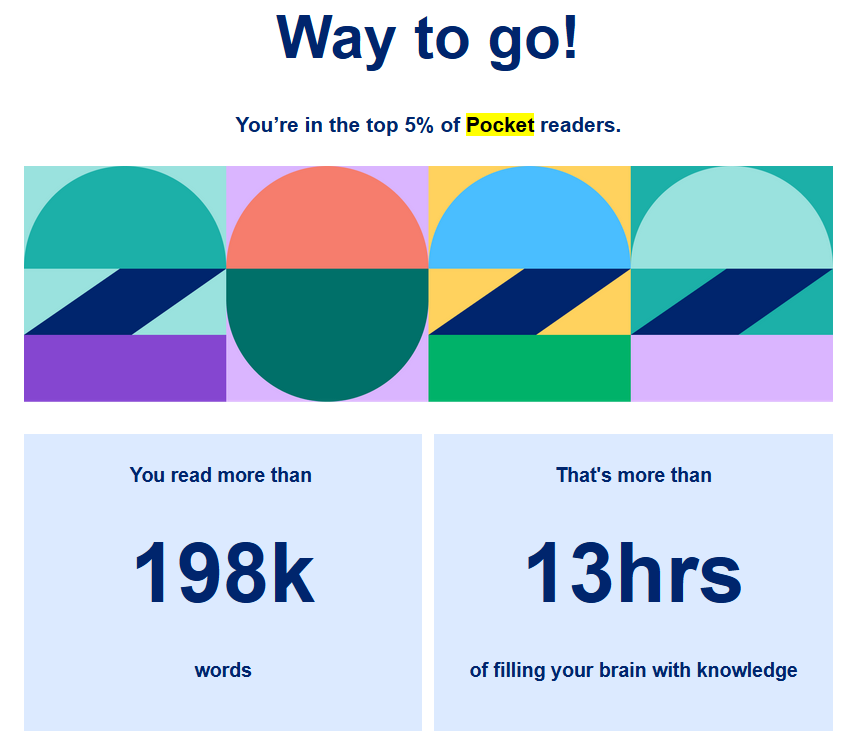
A lot of time I wonder if I’ll ever be able to finish my pocket list. This is because a lot of great articles that I find on the internet, I just save them for later and then never actually end up reading them. So the list continues to grow but I’ll try to give the pocket list more time this year(maybe 😅).
Music
I continued to use Spotify along with last.fm. The combo just seems like a perfect way to track the music you listen to. While going through some Reddit posts about self-hosting the idea of self-hosting your music did come to my mind but the thought of not being able to randomly search for a song and listen to it on the go isn’t very attractive to me right now. So I guess I’ll stick with Spotify.
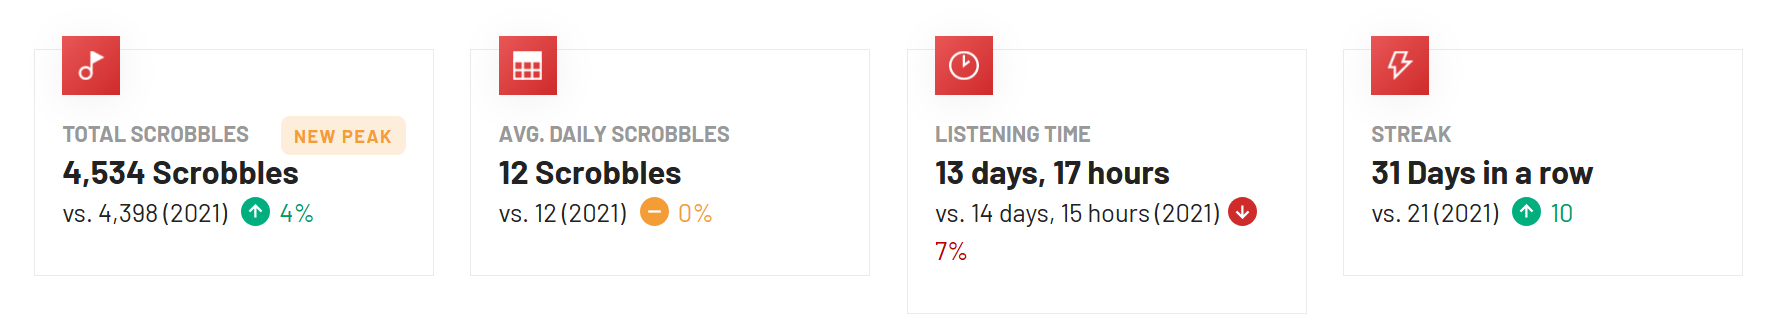
This year the scrobble count went up and that is interesting because I was more focused on listening to books on audible this year rather than podcasts/songs but I think music is something that just finds ways to sneak into your life.
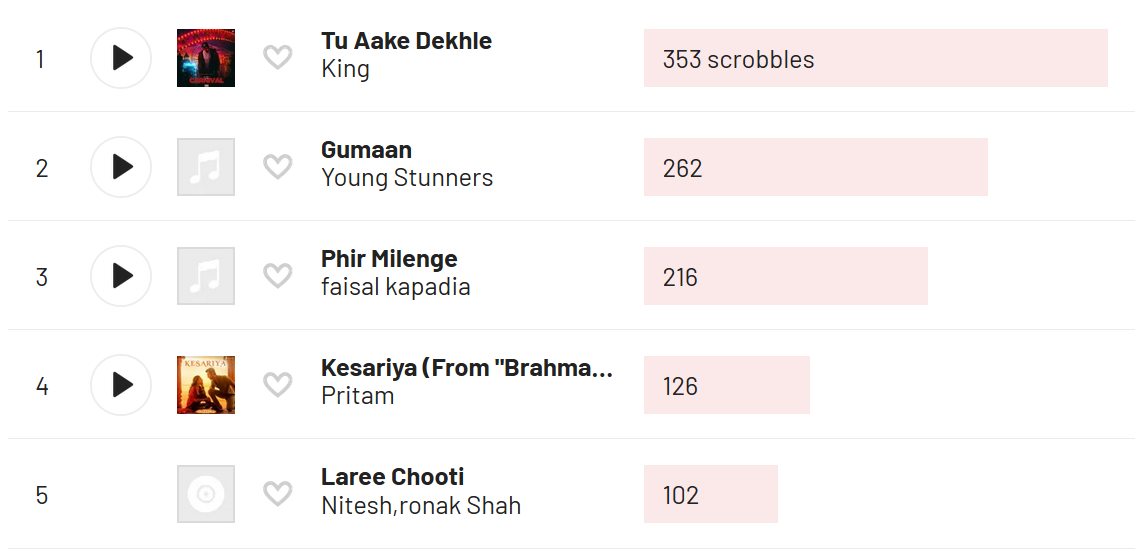
Looking at my top songs, I just knew these were going to be there. I literally have the top three songs in a separate playlist named “loop worthy”. So that should explain their presence at the top of the list. I was surprised to see number 5th make the top five. The song is good and I enjoy listening to it but I just didn’t expect this song to be that high on the list.
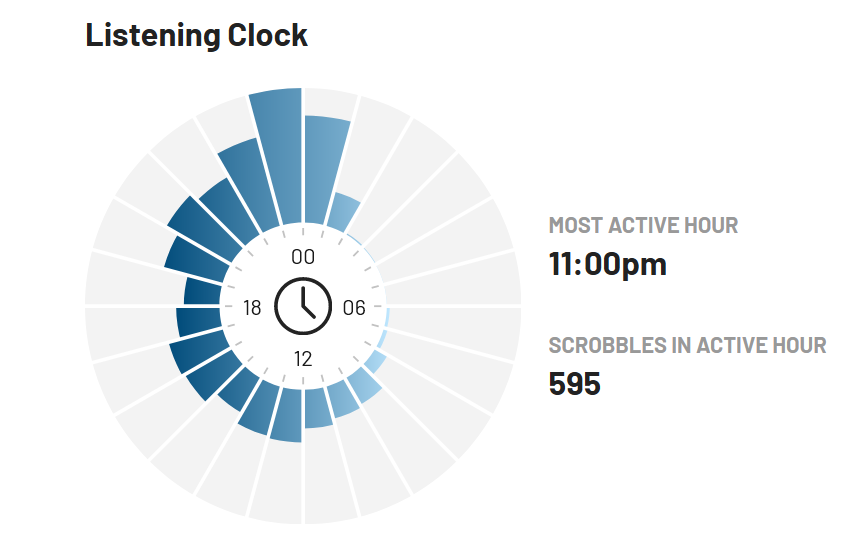
One thing that I absolutely love from last.fm stats is this listening clock. They basically tell you the time of day you spent most listening to songs(by counting the scrobbles). The interesting thing about this is that in 2020, my most active hour was 12:00 AM, in 2021 it was 10:00 PM and in 2022 it was 11:00 PM.
Thanks to Spotify wrapped, below is the list of my top podcasts.
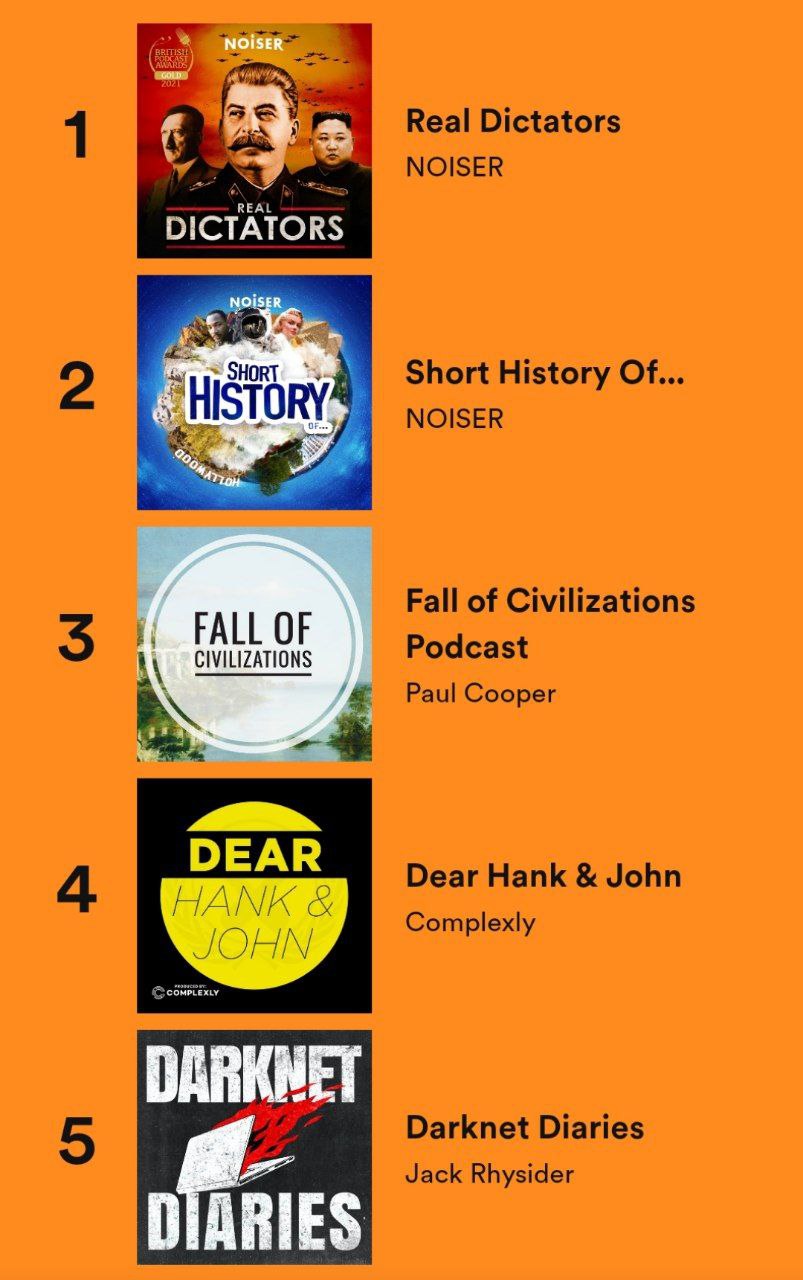
I am happy that Real Dictators is my top listened. I listen to that podcast, 10% for the history and 90% because of Paul McGann’s voice, it is just mesmerizing. I feel like he can talk about anything in his voice and I’d happily listen to it.
This year I found myself listening to Darknet Diaries a bit less because I feel like a lot of the episodes were interviews of people already in public lighting. I kinda already knew about those people, I mean the story they shared were cool but from a podcast like darknet diaries I’d expect more of the underground stuff(Underground Xbox is still the best episode of this podcast).
Movies & TV Shows
I’ve continued to use Trakt.tv. Toward the end of 2022, they had a database-related incident due to which the website was down for more than a week. During that time I seriously thought of finding an alternative or even trying to make my own but then the website came back and I kinda procrastinated on the idea of creating a self-hosted alternative to trakt.tv
Now looking at some data, I spent around 96hrs watching movies and 818hrs watching TV shows. That is around ~38 days in total. In 2021, I spent around 30 days doing the same. So in 2022, I’ve spent more time watching shows/movies.
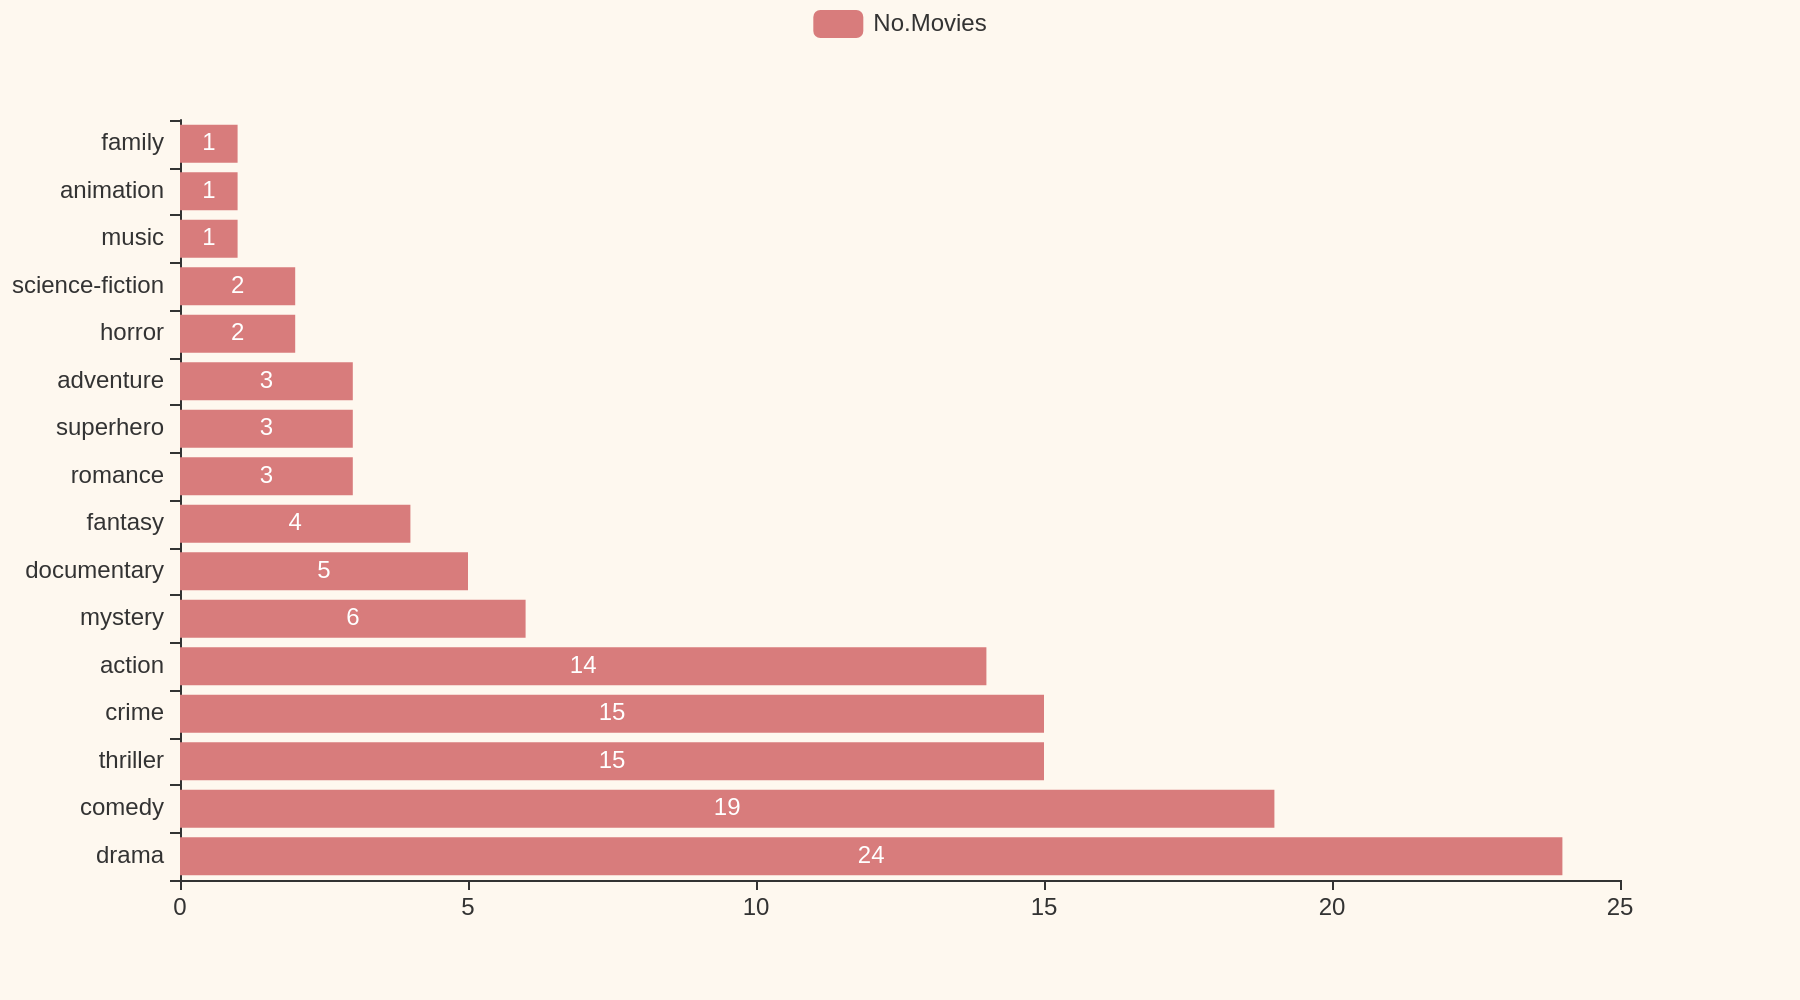
Just like every year, here is a graph showing the ratios of movies to the genre I’ve watched. Drama, comedy & thriller continues to be a few of the top genres which interest me. One new thing I did this year was to make a chart showing genres that have interested me over the years.
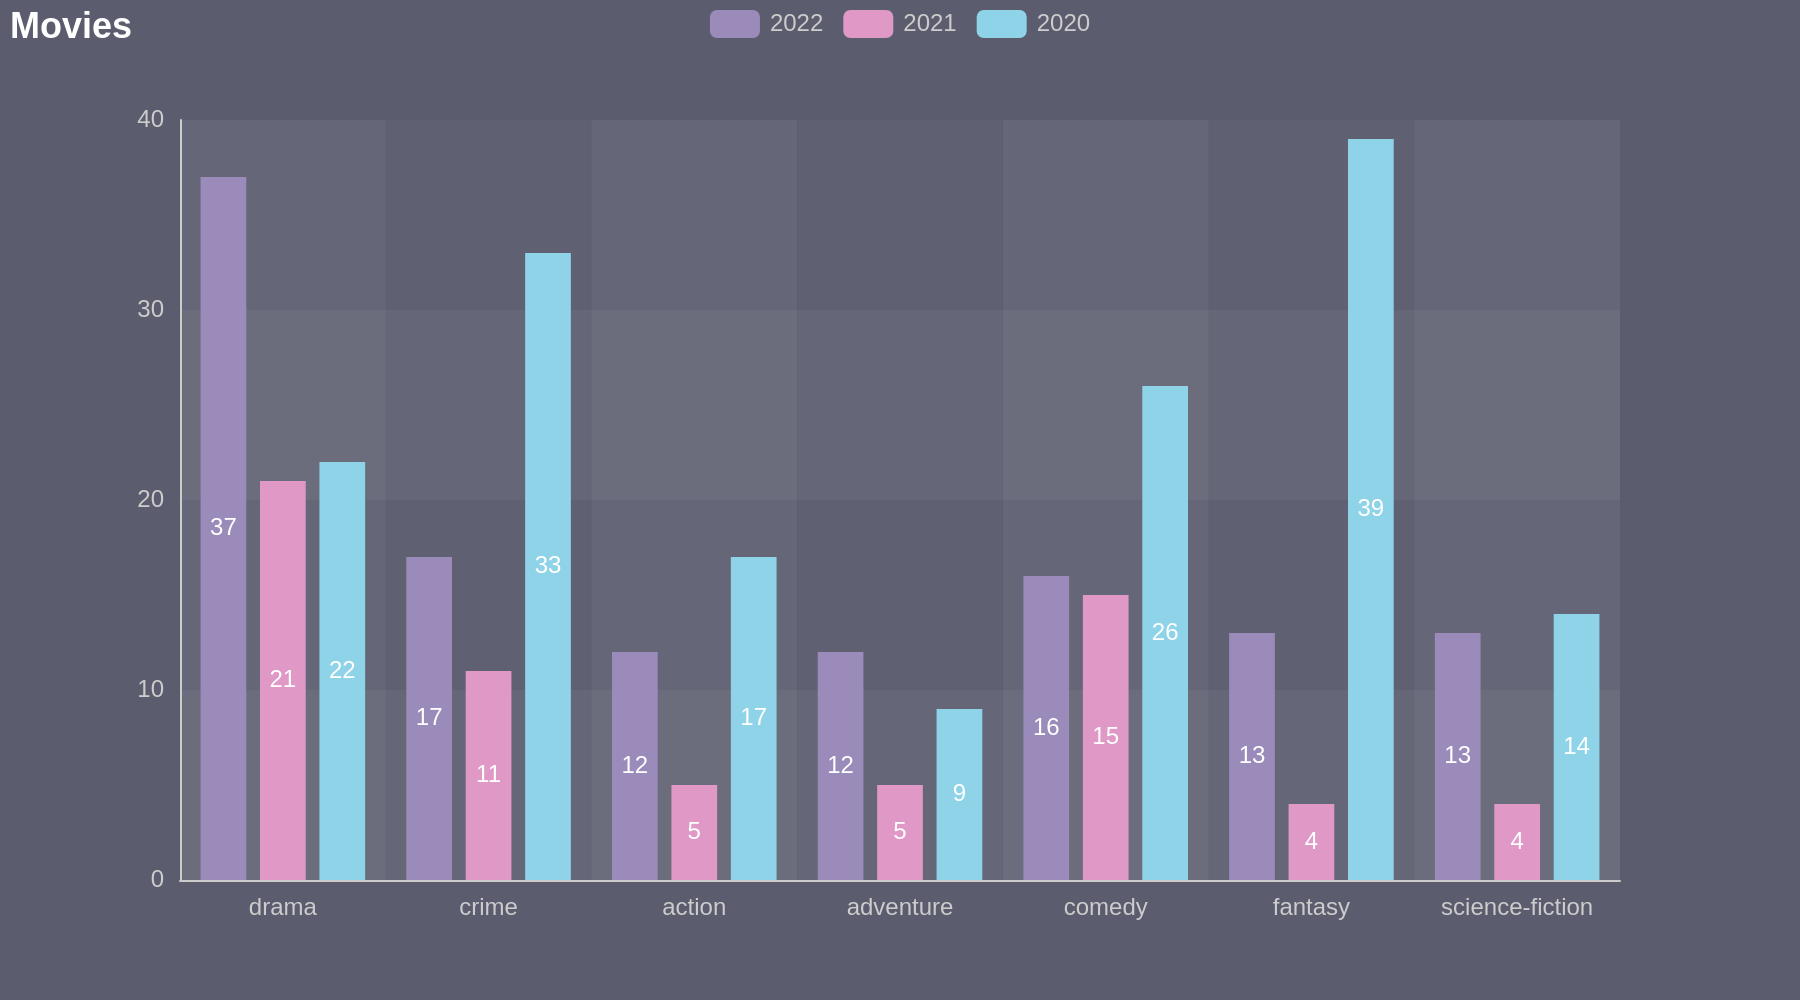
As we can see above, I gave fantasy a try in 2020, but then lost interest in it. I was a bit surprised to see crime peak in 2020 instead of 2022. This is because I feel like I watched more crime drama this year but the data says something else. Anyways, moving on to the TV shows data.
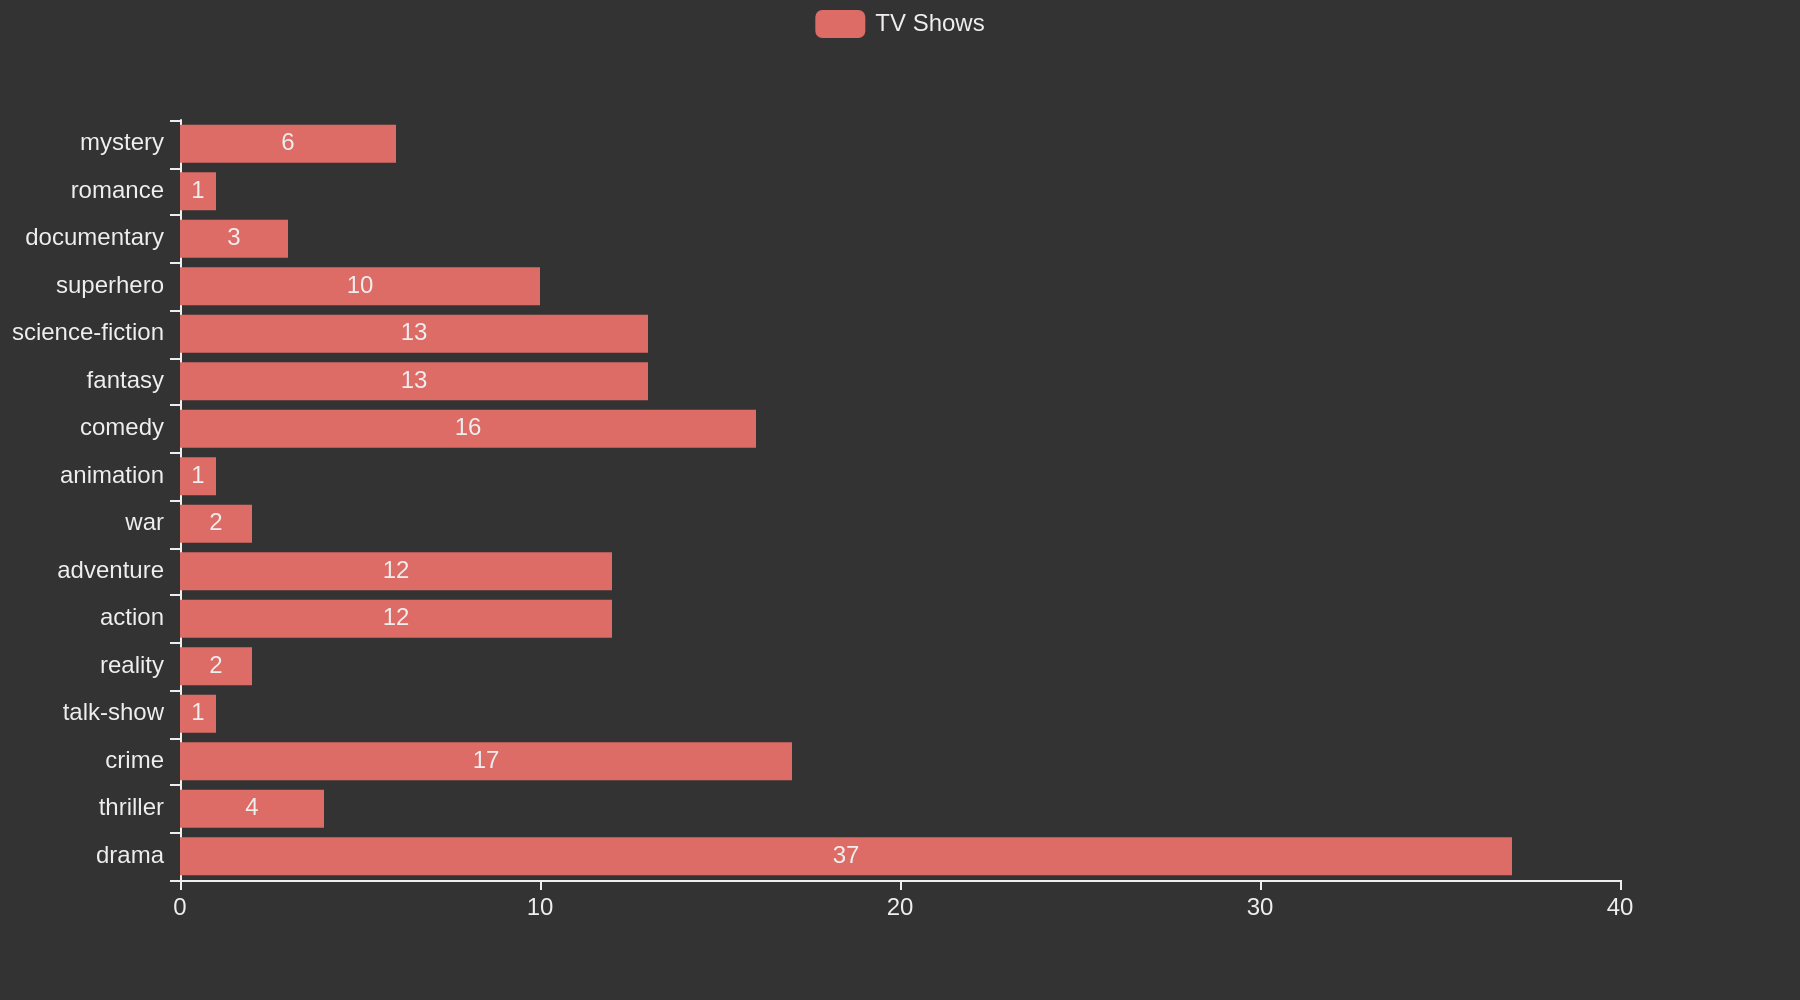
Crime and drama are again two big genres. I think this is because the majority of shows or movies that have come out in recent years can be categorized as drama.
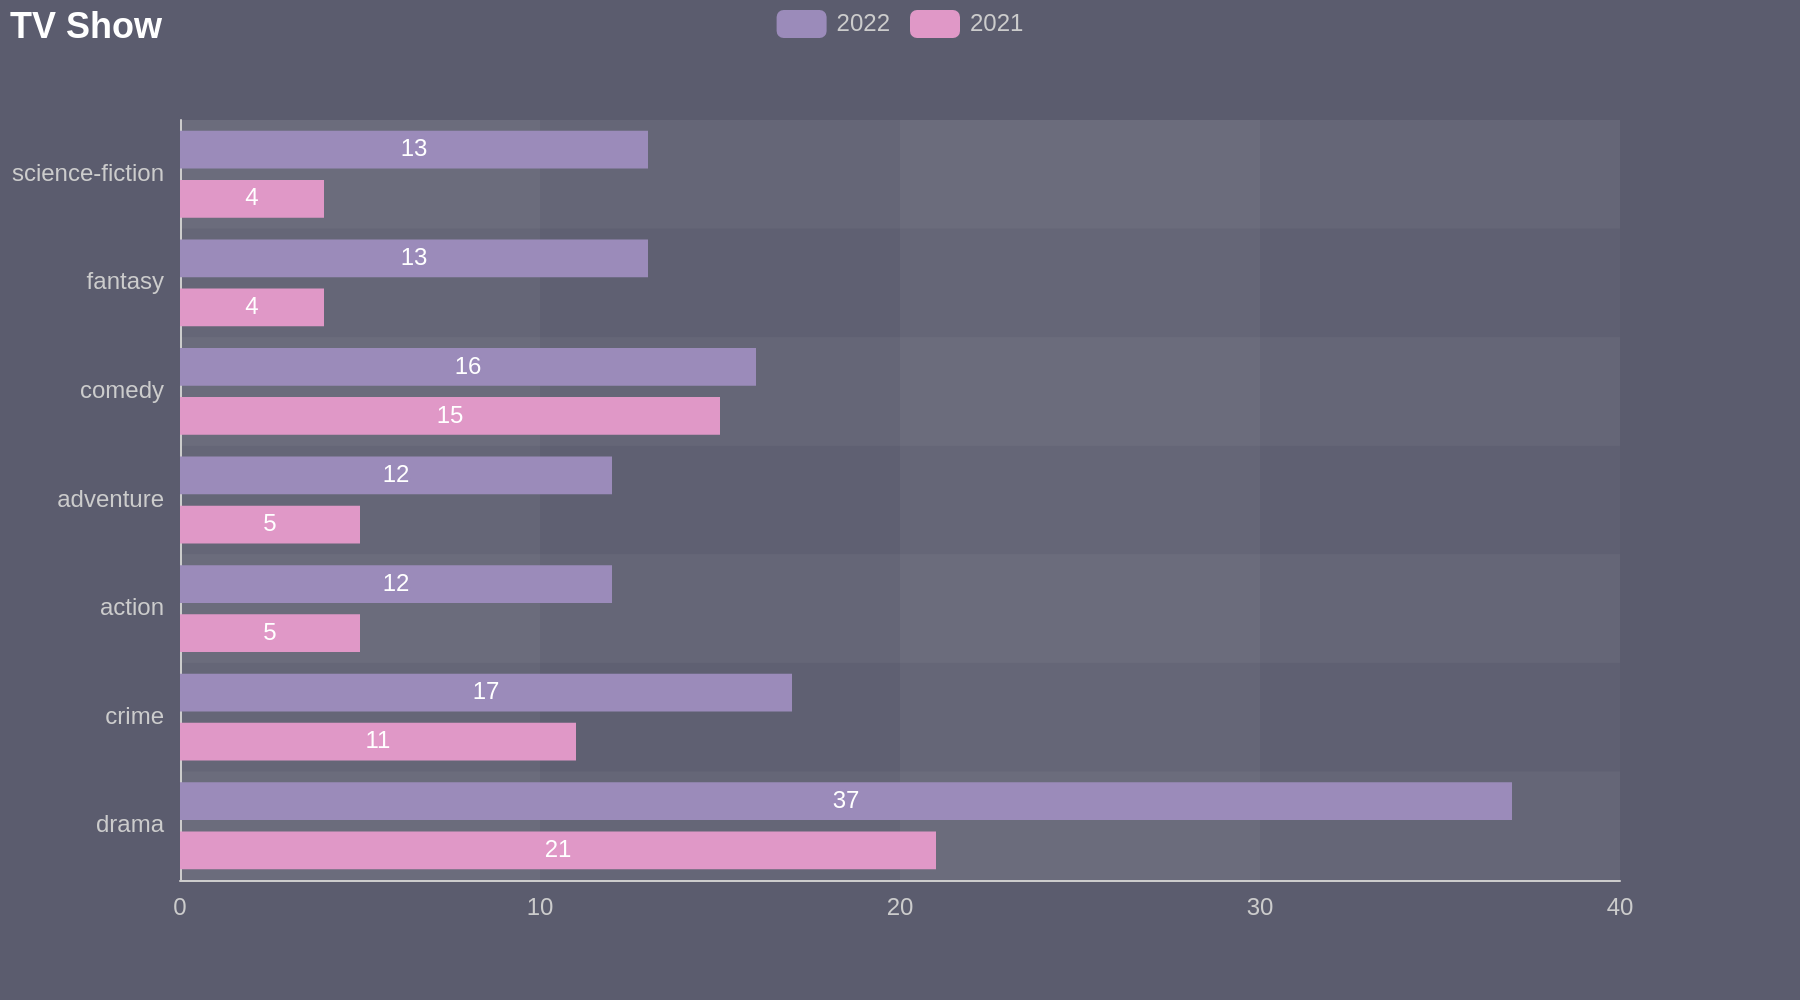
I did the same thing with shows as well. Compared the data from the last 3 years. And it just shows that I watched everything more in 2022.
PC & Phone Usage
I stopped using App usage that is because ActivityWatch Android App seemed like a better option since I was already using activity watch for PC. The move did help since I didn’t have to change much in the code to generate some simple graphs.
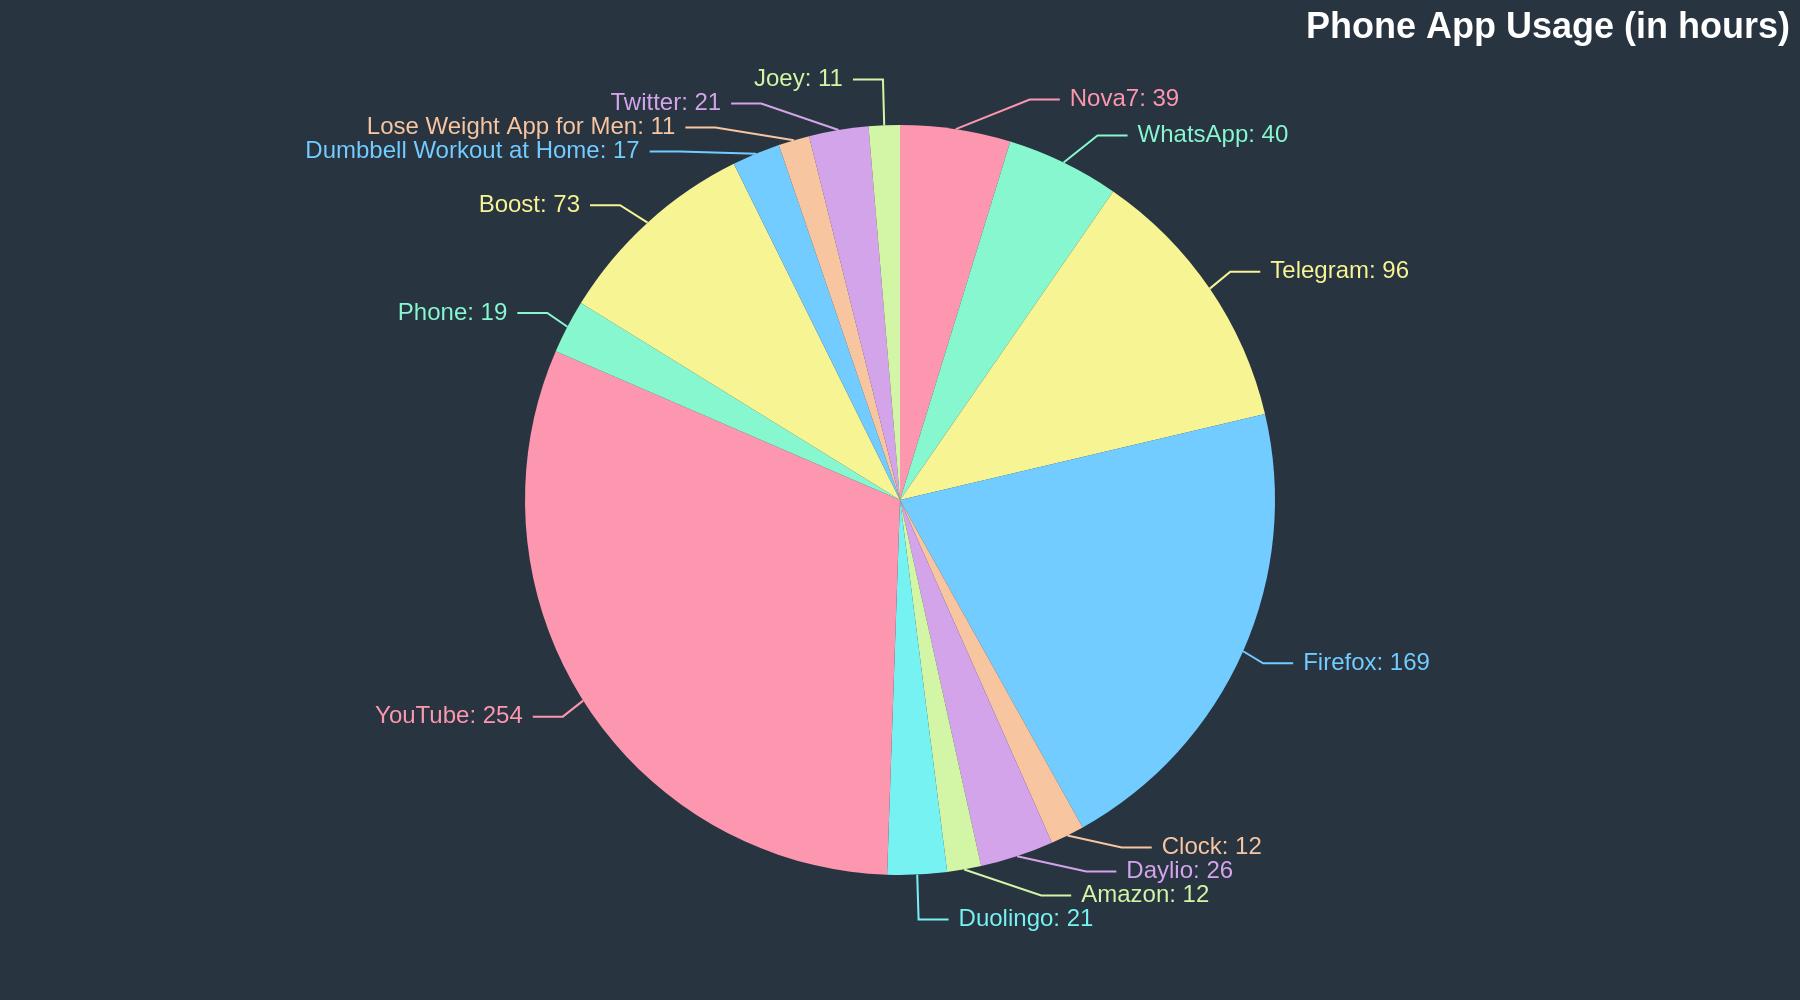
My total phone usage went from 64 days in 2021 to 43 days in 2022. That is actually good news for me. And looking at the above pie chart I can see a big difference is obviously because of youtube. AFAIK, I had around 400 hrs on youtube in 2021 but it’s almost half in 2022.
Another thing that I am happy about is that I did use the weight loss app for a good amount of time. Even though the sum is around 28 hrs(17+11) I know I worked out for more than 28 hrs in a year. I know this because my weighing scale tells a different story. I am not at my ideal weight right now but I am pretty close.
One weird thing is that the clock app was used for 12 hrs in a whole year, not sure why it would be that high. The only time I can imagine myself using the clock app is to set alarms, which I don’t do much.
Moving onto PC usage, it went a bit up this year. In 2021 I had 119 days of PC usage and it went to 143 days in 2022. To be very honest, a PC is literally one thing that I use all the time so seeing its usage go up isn’t very shocking.
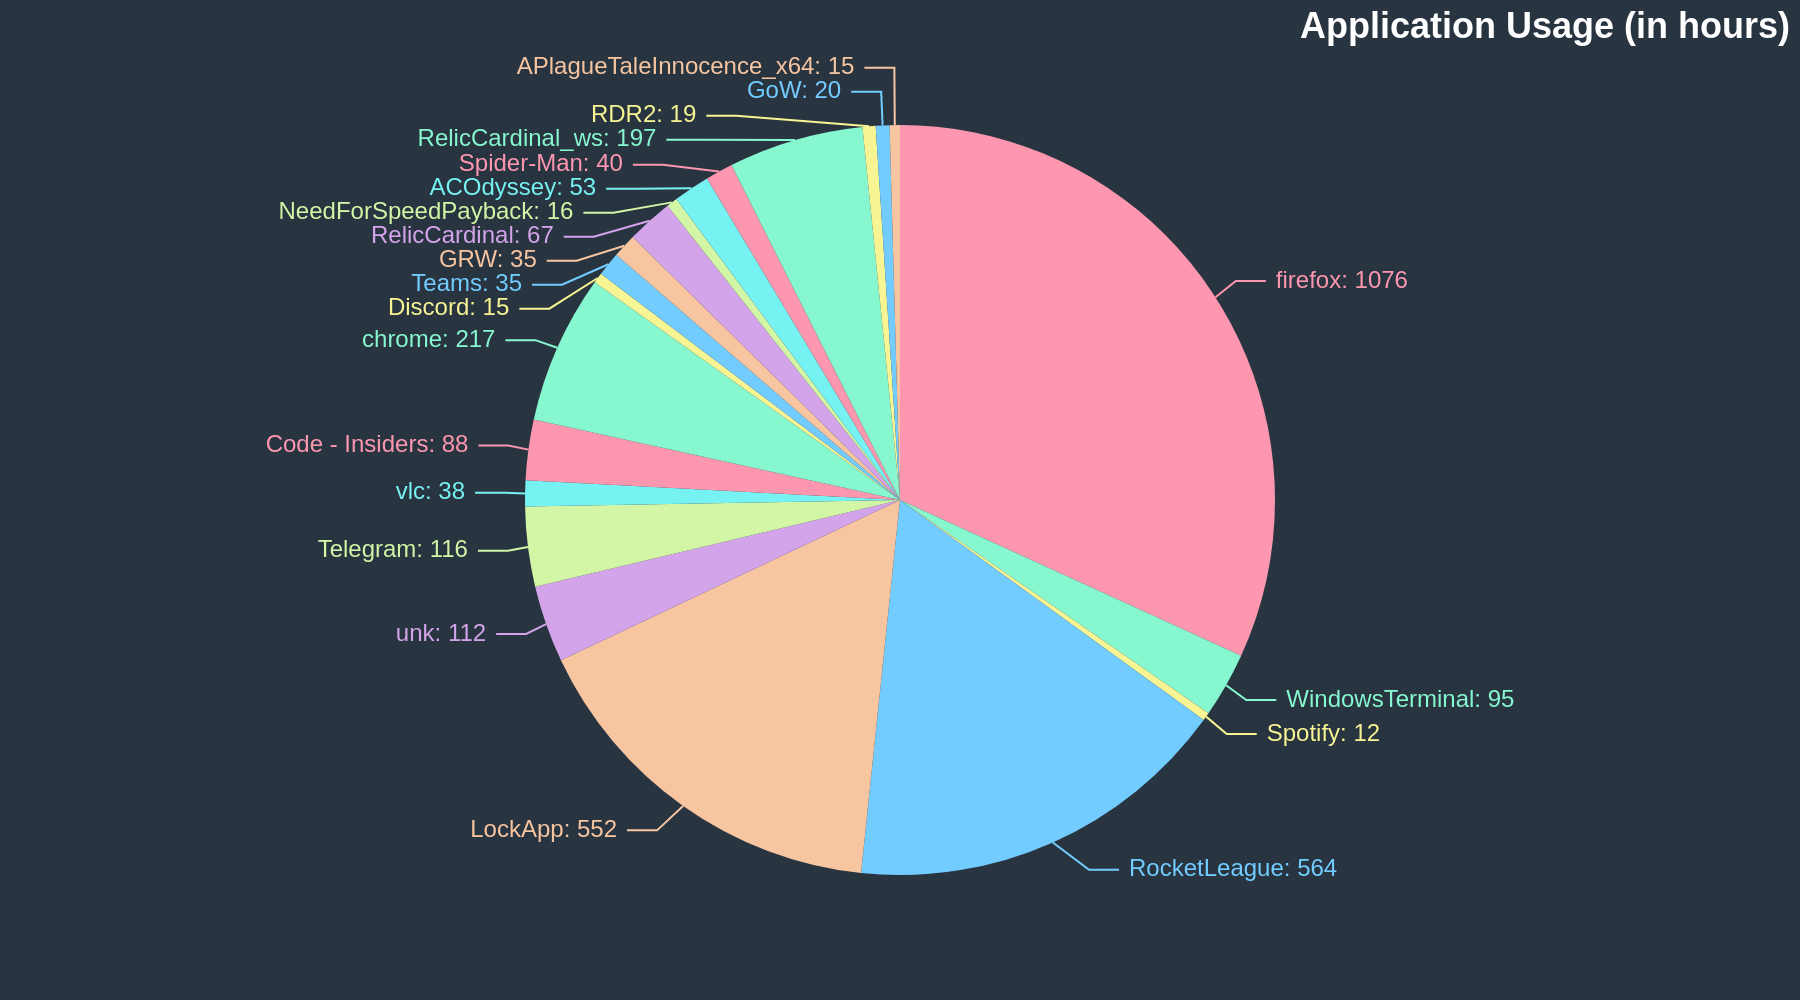
If we look at the pie chart, obviously the browser is top on the list. And then if you look closely you’ll notice a lot of games, RocketLeague, God of War, Assassin’s creed odyssey, Spider-man, etc. So basically I used PC for what it was supposed to be used i.e playing games.
I did spend a good chunk of time on Windows Terminal and VSCode because those are two things that would be used for work-related things. But what I don’t have the data for is how many of those terminal hours were on vim(lvim). I should probably get the activity watcher for vim as well.
This year another thing I was interested in was seeing detail on those firefox hours.
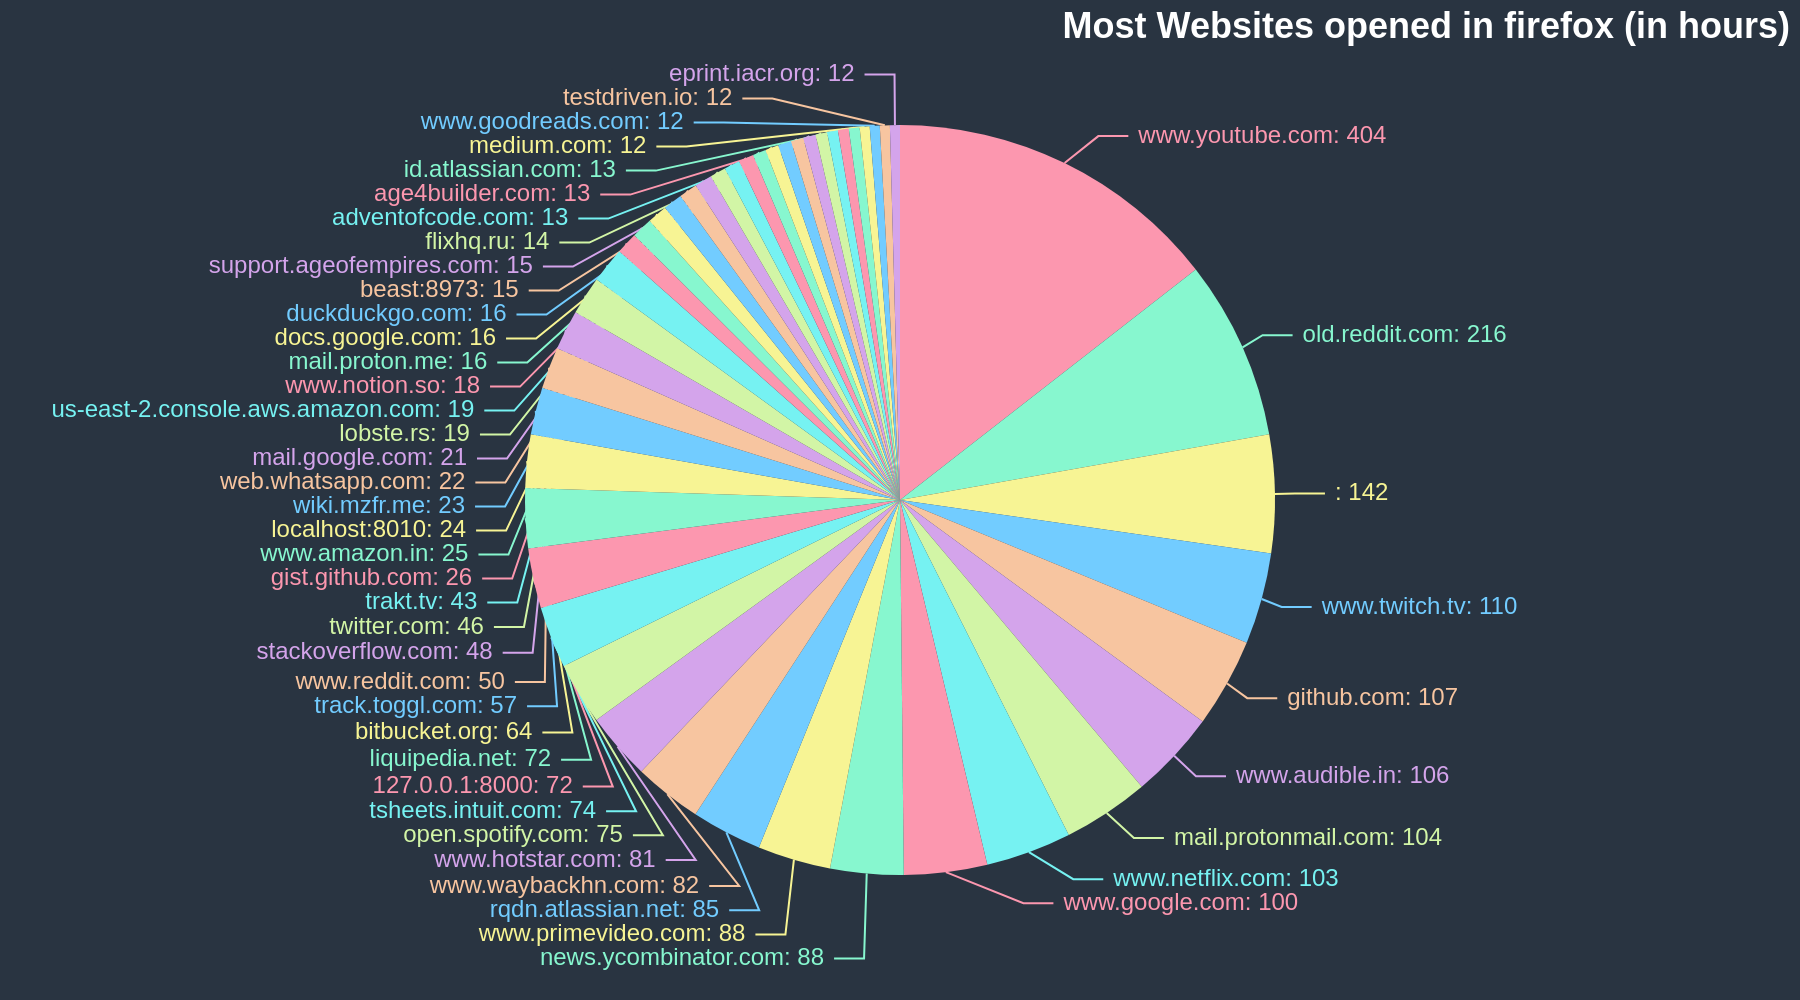
First of all, can we just appreciate how beautiful this piechart turned out to be? I mean the spatial use in this pie chart is top-notch.
Secondly, I am really surprised to see a lot of the websites here because some of those I definitely used maybe in the early part of the year but towards the end of the year I stopped using those websites for various reasons. Maybe I found a better alternative for the service or maybe I started to self-host the utility it was providing.
One interesting website is www.google.com, not sure why I had that opened for almost 100 hrs. And maybe more interesting than that is that I had the “New tab” open for almost 142 hrs. In the chart, there is no website linked to it that is because there is no domain name for the New tab but that is really interesting to see.
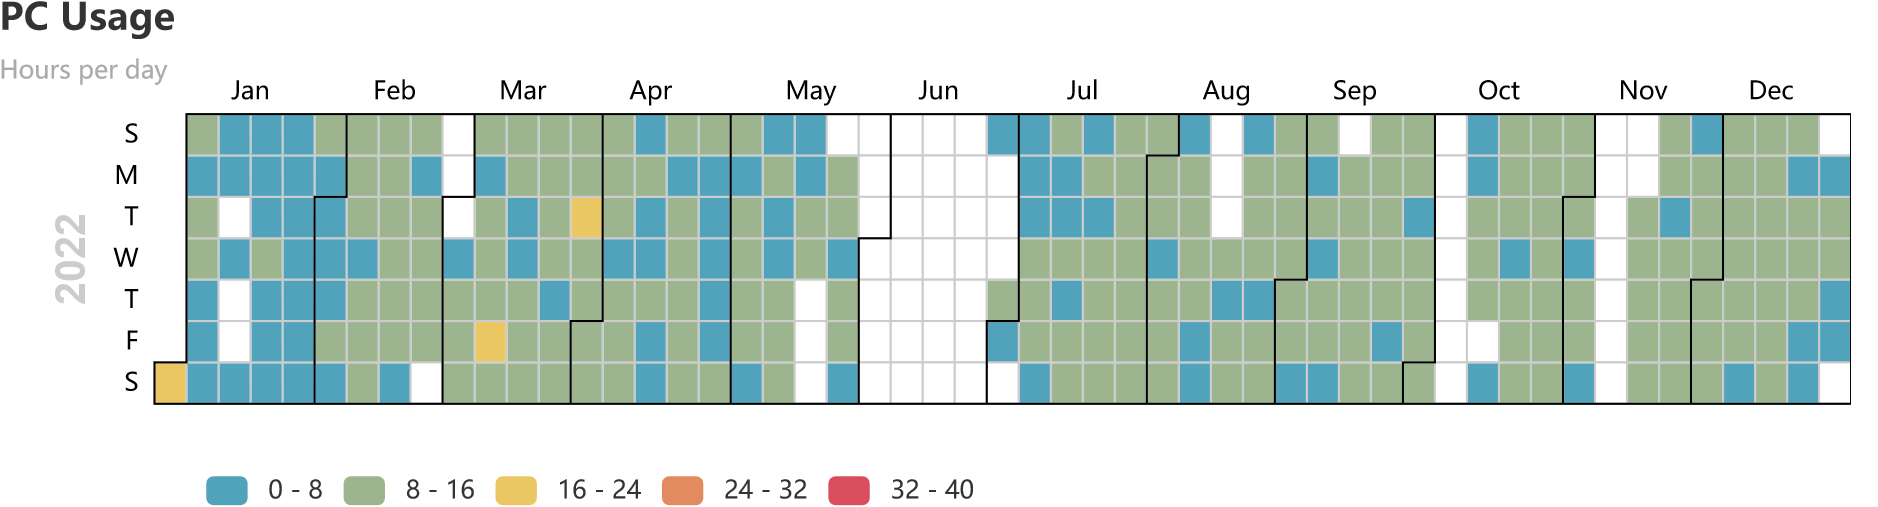
I really find the heatmap fascinating. The moment I looked at this heatmap I immediately knew the months/days I was on vacation or wasn’t at home. And then all the good times start to come to you 😁. The whitespace in the month of June was probably some of the best times of 2022. Now obviously I wasn’t completely away from technology during that time but I remember I didn’t have to spend my free time just playing games, I actually touched grass 🌴 during that time
Conclusion
Not gonna lie, for me this year felt a bit slow. There wasn’t much to do or you can say I didn’t do much this year 😁. Whatever it might be but there weren’t many big changes in my life. Now that can be considered both good or bad depending on how you want your life to move.
If I forget all the stats and just close my eyes & think about 2022, I’d say
- I had my first-ever trip with friends
- I spent quite a good chunk of money on my hobbies
- Professionally speaking the value of my “number of years of experience” increased by 1
So all in all this was a pretty good year.
At last, I’d encourage the readers they do a similar thing with their data, even if you don’t put it out publically but there is definitely a lot of stuff data can tell you about yourself. And If you don’t have data to start with, then you already have one extra task to work on this year.