⚠️ It is possible that you might read this post and realize that there are much easier ways to solve this problem. If that is the case please let me know.
Problem Description
I wanted to add a “print to PDF” button on a dashboard which is supposed to show teachers an update about their student’s work.
The dashboard shows various tables with information about all the things that the student has answered/asked/submitted etc. The application is built using the Django framework with very minimalist CSS & JS.
Technical Description
As I said the application is built using the Django framework with really minimalistic JS. And some chunk of that JS is written to generate graphs on a teacher’s dashboard, using chart.js library.
Below is a heavily redacted version of the teachers_dashboard.html template which is being used to show stuff to teachers.
{% extends 'header.html' %}
{% load static %}

{% block extra_head_content %}
{{ block.super }}

// chart.js script link hosted internally

{% endblock %}

<body>
// Lot of code for tables and other bootstrap elements

<a class="btn btn-primary" href="{% url 'generateReport' %}" target="_blank" role="button">Generate Report</a>

</body>

// Script responsible for generating doughnut charts using chart.js and the context data being passed by Django views
The roundabout
When the ticket for the above-mentioned problem got assigned to me I was pretty confident I can finish the implementation in around 20-30 minutes. But boy was I wrong.
The very first google search suggested that I use the library weasyprint, so I did another google search “weasyprint Django” and took help (yes I copied the code) from this article. Once everything was done, I clicked on the newly placed Generate Report button on the dashboard and got a PDF. But it was missing all the doughnut charts which I could clearly see on the dashboard.
So it was time for another google search, and after some time I finally landed on this issue(https://github.com/Kozea/WeasyPrint/issues/817) when I noticed it was closed I took a breath of relief because obviously someone else had this issue and people must have already suggested a solution for it which lead to the closure of that issue. But when I read this comment(https://github.com/Kozea/WeasyPrint/issues/817#issuecomment-470079749) my heart sank, life seemed meaningless. I was asking questions like, what is even the point of having open source libraries if I can’t just simply use them without having to worry about “stuff” (/s)?
Anyways by the time I was done reading that thread, I could already see two alternatives suggested by one of the maintainers of the weasyprint library.
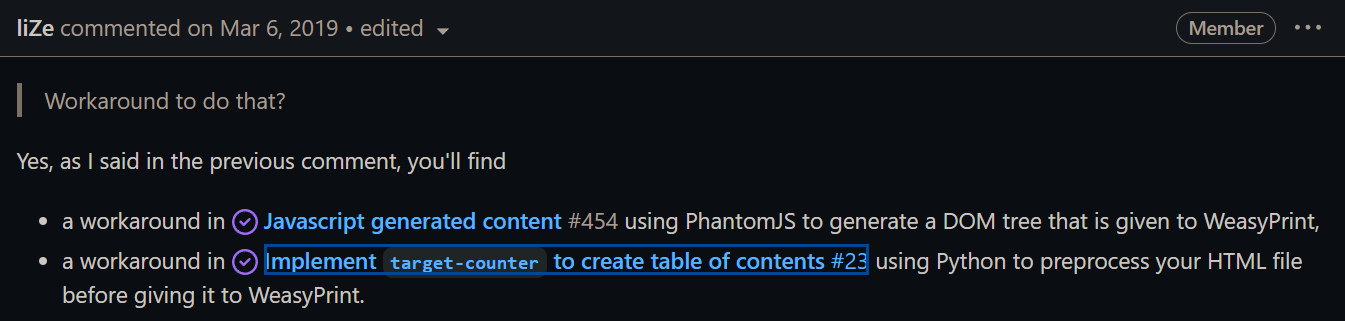 Taken from https://github.com/Kozea/WeasyPrint/issues/817#issuecomment-470084446
The first alternative is suggesting to use Phantomjs. But the moment you open the website you’ll notice something along the lines of:
Important: PhantomJS development is suspended until further notice (more details).
When I read the above line I felt that it might not be the best option to use something which isn’t active development (I am going to regret making this decision later). So I started looking into the second alternative(https://github.com/Kozea/WeasyPrint/issues/23). But the thread also wasn’t much help. So at that time, I realized that weasyprint was not the right way to do it.
Then after a bit more looking around I found another library named xhtlm2pdf. When I started to read the documentation I felt this must be it because they even had a separate section on how to use that library with Django (Using xhtml2pdf in Django). So I simply copied the code from their documentation and again waited for my beautiful PDF to come out. But I was again disappointed because this PDF was not only missing charts but also basic bootstrap CSS.
The reason for the missing CSS was that my link_callback function wasn’t working properly and for missing graphs were because I didn’t use something called canvas in the template being used for generating the report. So after making the necessary changes I was once again full of hopes, which were shattered a few seconds later. I really spent a good amount of time trying to figure out why the graphs were not showing up and that everything was the way it should be. I tried searching old/open issues on the repository to see if this library also has something similar to what weasyprint had, but I didn’t find anything which might tell me why I was having this issue. So about 3-4 hours later I was back to square one.
Now that both the heavily used libraries were out of option I thought of trying to use matplotlib to generate the graphs as images and put those images on the dashboard. The issue with that was the default images being generated by that library had a white background and even with the dark background it was easily noticeable that someone has added weird images on the dashboard or in the report. So I had to drop this idea as well.
Solution
⚠️ Disclaimer ⚠️ I am not really good with JS or CSS so if the things you are about to read make your skin crawl or something, I apologize in advance**
In the end, I decided to use wkhtmltopdf. I did some manual testing with it and the only thing it didn’t do was show the chart in the PDF. Other than that I felt like the CSS rendering quality of this tool was higher than xhtml2pdf or weasyprint.
But still, there were two three issues with wkhtmltopdf
- wkhtmltopdf isn’t some python library but a tool written in C++ and you basically get a binary of this tool to use it on CLI.
- It doesn’t process JS in the given template just like weasyprint.
- oh and also the repository was recently(Jan 2, 2023) archived - read project status to know why? (https://wkhtmltopdf.org/status.html)
Problem 3
For this, I simply decided that the repository was recently archived and is still going to be functional for quite some time. So in simple terms, I decided to ignore the idea that I am putting an unmaintained tool in my new project (something I could have done with PhantomJS 🤦♂️).
Problem 1
It isn’t exactly a library but there is a library called django-wkhtmltopdf which can be used along with a binary in any Django project. So this problem was also solved easily.
Problem 2
This was basically the whole crux of the problem. This is the same issue I faced with weasyprint and xhtml2pdf(maybe). I needed a way to same those chart.js doughnuts as images, then add those images to a template, and then pass that template along with another context(data to fill in tables/headers, etc) to wkhtmltopdf tool.
So here is what I did:
- In the
teachers_dashboard.htmltemplate I added the following JS:
    $(document).ready(function () {

    // Lot of other function call to show all the dashboard stuff

    charts.image = myChart2.toBase64Image();
    let csrftoken = getCookie('csrftoken');

    fetch('{% url "locallysavegraphs" %}', {
        method: 'POST',
        headers: {
            'Accept': 'application/json, text/plain, */*',
            'Content-Type': 'application/json',
            'X-CSRFToken': csrftoken
        },

        body: JSON.stringify({ chart: charts.image })
    }).then(res => res.json())
        .then(res => console.log(res));

    // This function was taken from Django documentation
    function getCookie(name) {
        var cookieValue = null;
        if (document.cookie && document.cookie !== '') {
            var cookies = document.cookie.split(';');
            for (var i = 0; i < cookies.length; i++) {
                var cookie = cookies[i].trim();
                if (cookie.substring(0, name.length + 1) === (name + '=')) {
                    cookieValue = decodeURIComponent(cookie.substring(name.length + 1));
                    break;
                }
            }
        }
        return cookieValue;
    }
});
When the teacher’s dashboard is loaded and chartjs generates all it charts we are taking the base64 of those images and then performing a POST request to another django endpoint(/locallysavegraphs).
That view is responsible for saving those base64 data into images and storing those images locally.
- I added the following line in the template which was going to be passed to wkhtmltopdf
<img src="<PATH_TO_THE_SAVED_IMAGES>" style="width: 30%"
I basically hardcoded the path to those images.
- I wrote the following view for generating the PDF:
from wkhtmltopdf.views import PDFTemplateResponse


class PdfGeneration(View):
    def get(self, request):
        get_context = FUNCTION_WHICH_GIVE_DATA()

        response = PDFTemplateResponse(
            request=request,
            template="HTML_TEMPLATE_FOR_MAKING_PDF.html",
            filename="PRODUCT_DASHBOARD.pdf",
            context=get_context,
            show_content_in_browser=True,
            cmd_options={"enable-local-file-access": True},
        )
        return response
The PDFTemplateResponse is provided by the django-wkhtmltopdf library. And to that function, we just pass the context, template, and some other options that wkhtmltopdf would take.
With this implementation, everything worked like a charm. I was initially expecting things to be a bit slow but I really didn’t notice any performance issue either on testing or on production.
While writing this post I realized that I could have done everything the same up until step 2 and then instead of using wkhtmltopdf I could have passed the same information to weasyprint. So what I mean to say is that I could have saved quite a lot of time if I had decided to make things work with weasyprint without easily giving up on it. Wow! this sounds like life advice.
Anyways, if you know better ways to print PDF from Django view(with content as well as charts) please let me know. Thanks for reading 👋