This is back-dated to 2025-12-31 but was actually published on 21/01/2026
Better late than never, I guess. I really intended to publish this on time; however, life got in the way. 2025 flew by, and I guess there isn’t much to say about it. While there were a lot of good things and several bad things, when I look back, it all just felt like “life”—nothing “exceptionally memorable”.
I think I’ve kept this tradition alive long enough that I don’t need to explain why I do this. But for the uninitiated: I love data, and I love seeing what my data says about my life. It especially helps me figure out what to do and what not to do next year.
As always, here are the links to the archives:
- Year In Review - 2020
- Year In Review - 2021
- Year In Review - 2022
- Year In Review - 2023
- Year In Review - 2024
Sleep
When I close my eyes and think about my sleep There is a bad pun here somewhere, I remember it as not so great, mostly because I remember several weeks where no matter how I changed my schedule, room temperature, screen time before bed, creatine, nothing worked, and I was naturally waking up with 5–5.5 hours of sleep.
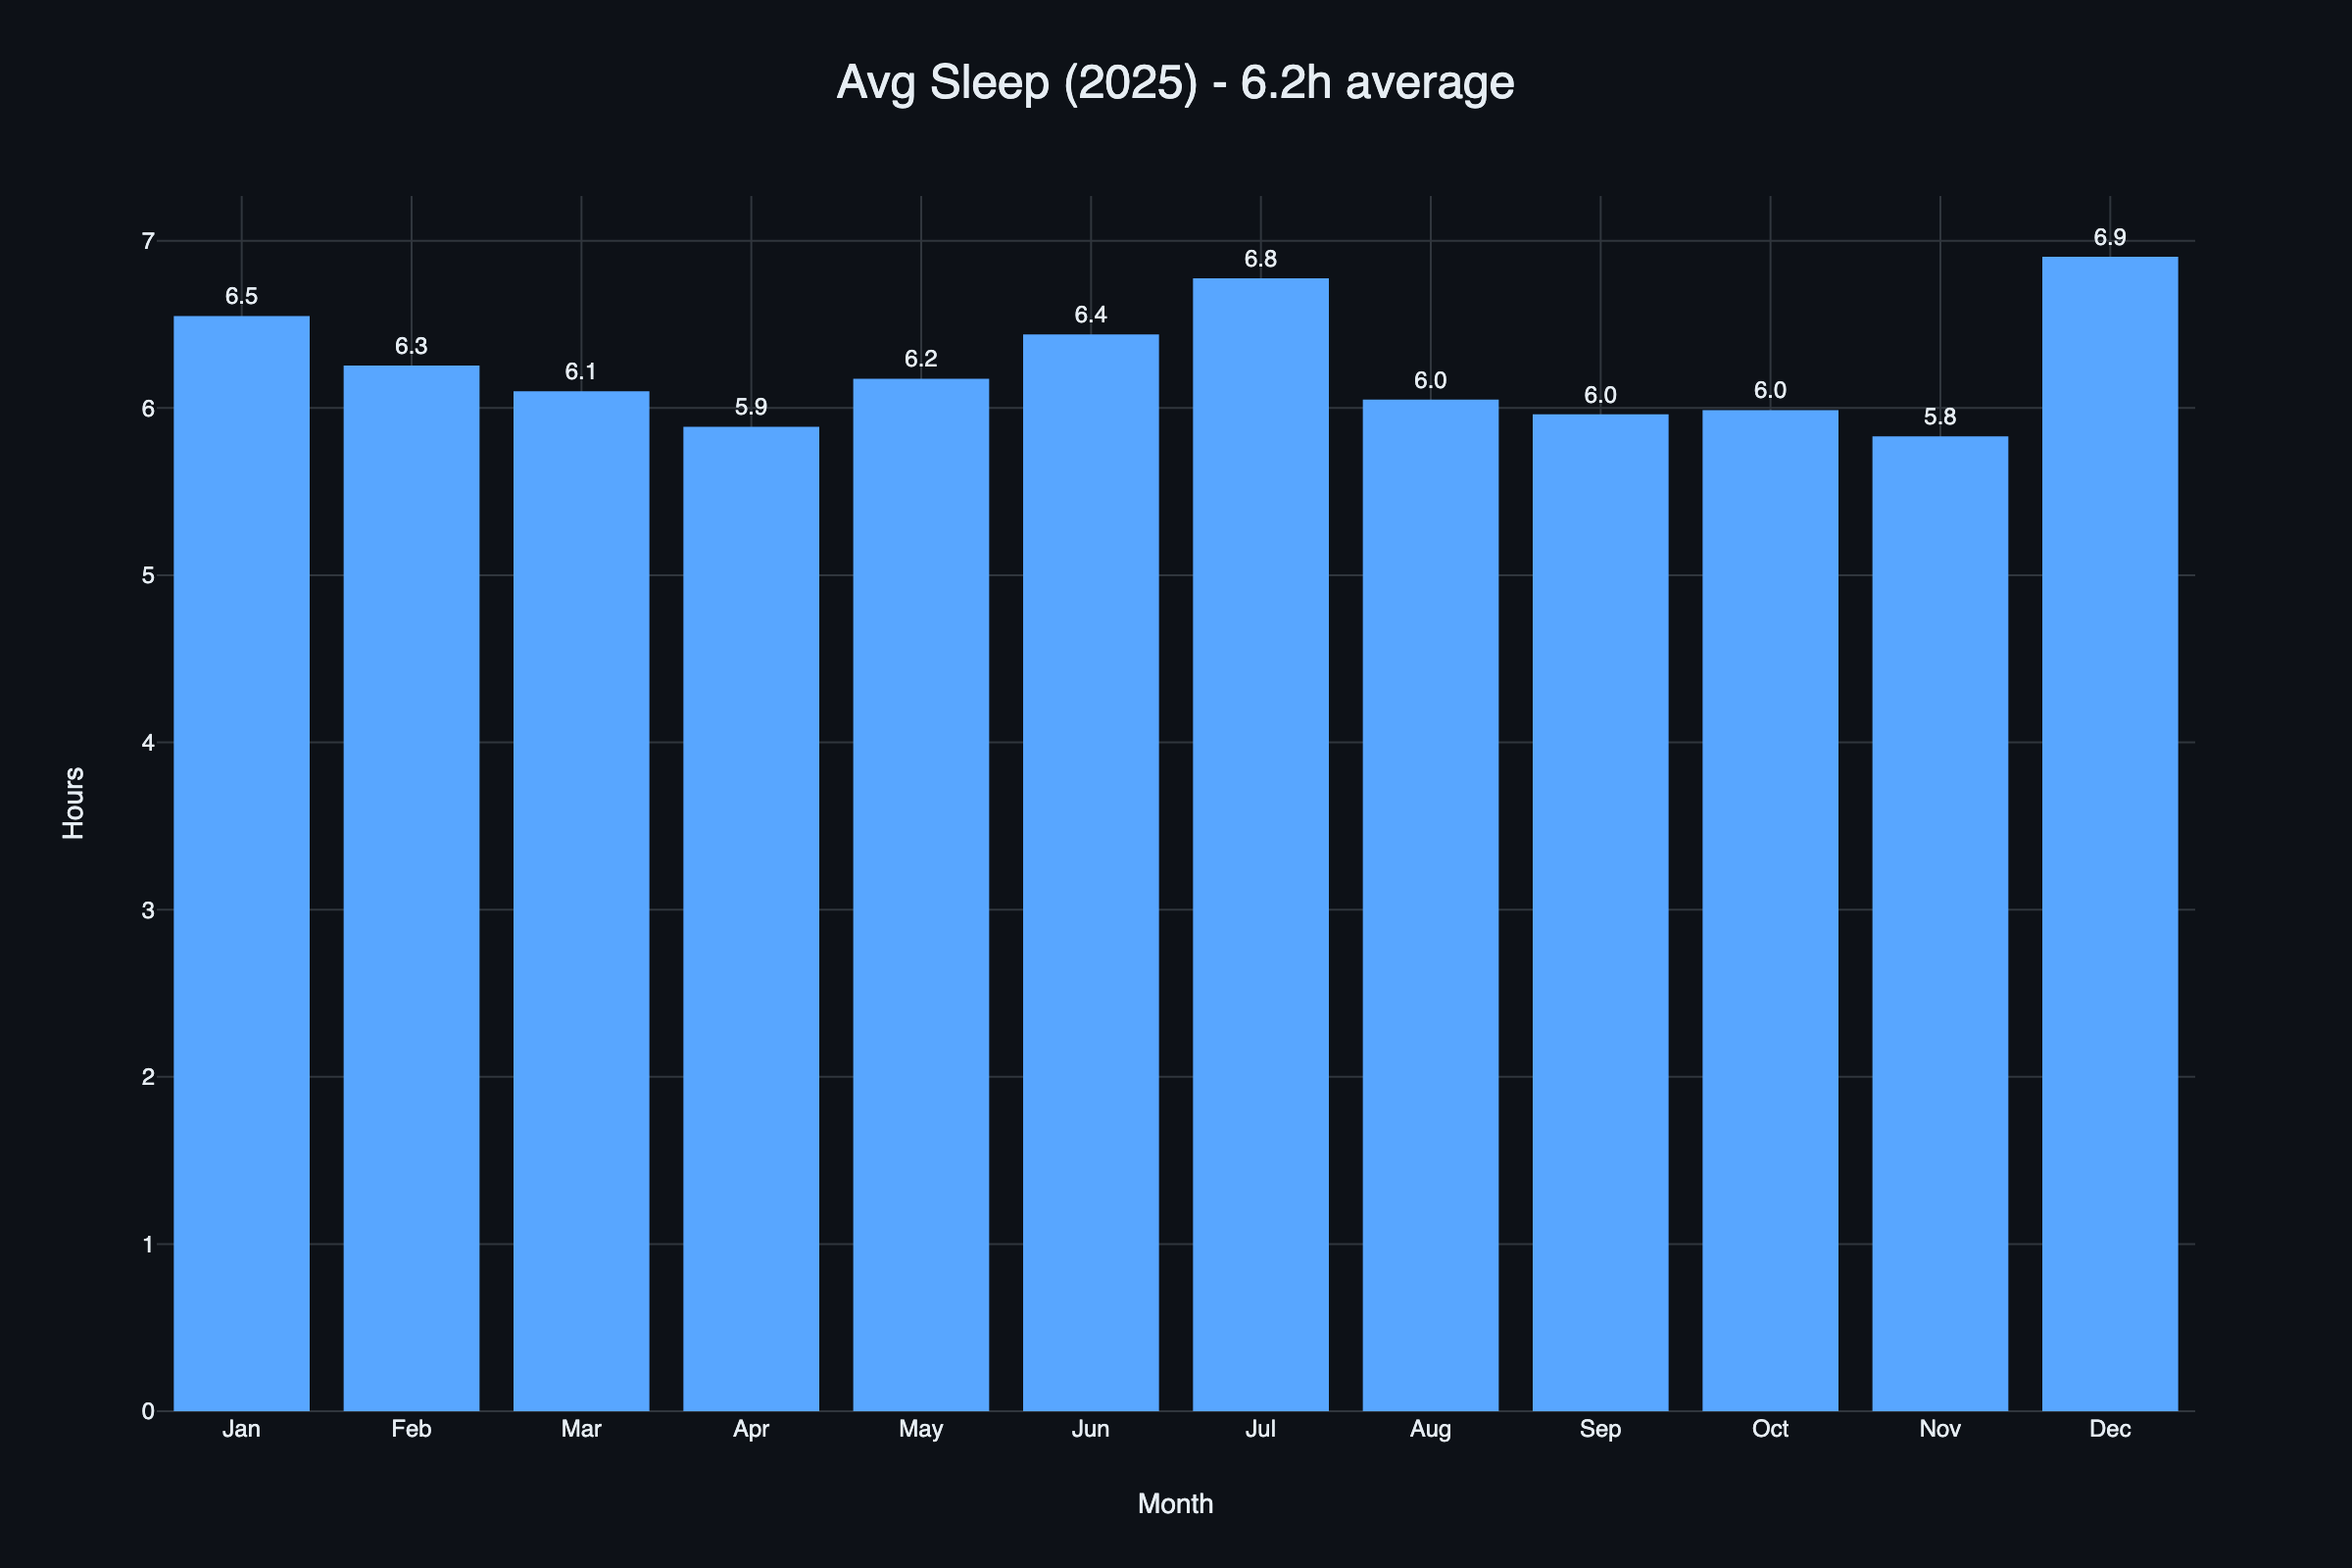
Looking back at the average, I can see that it was probably April and November. I have no idea why those two months are a bit low. I mean, sure, in the sense of workload, there were weeks where things were a bit hectic, but I genuinely can’t recall a reason specific to those months.
But what I know for sure is that January, July, and December were high because I was on vacation. The moment vacations start, I somehow automatically go into an 8+ hr daily sleep cycle. And also, surprisingly, there isn’t much difference in the average sleeping time as compared to last year.
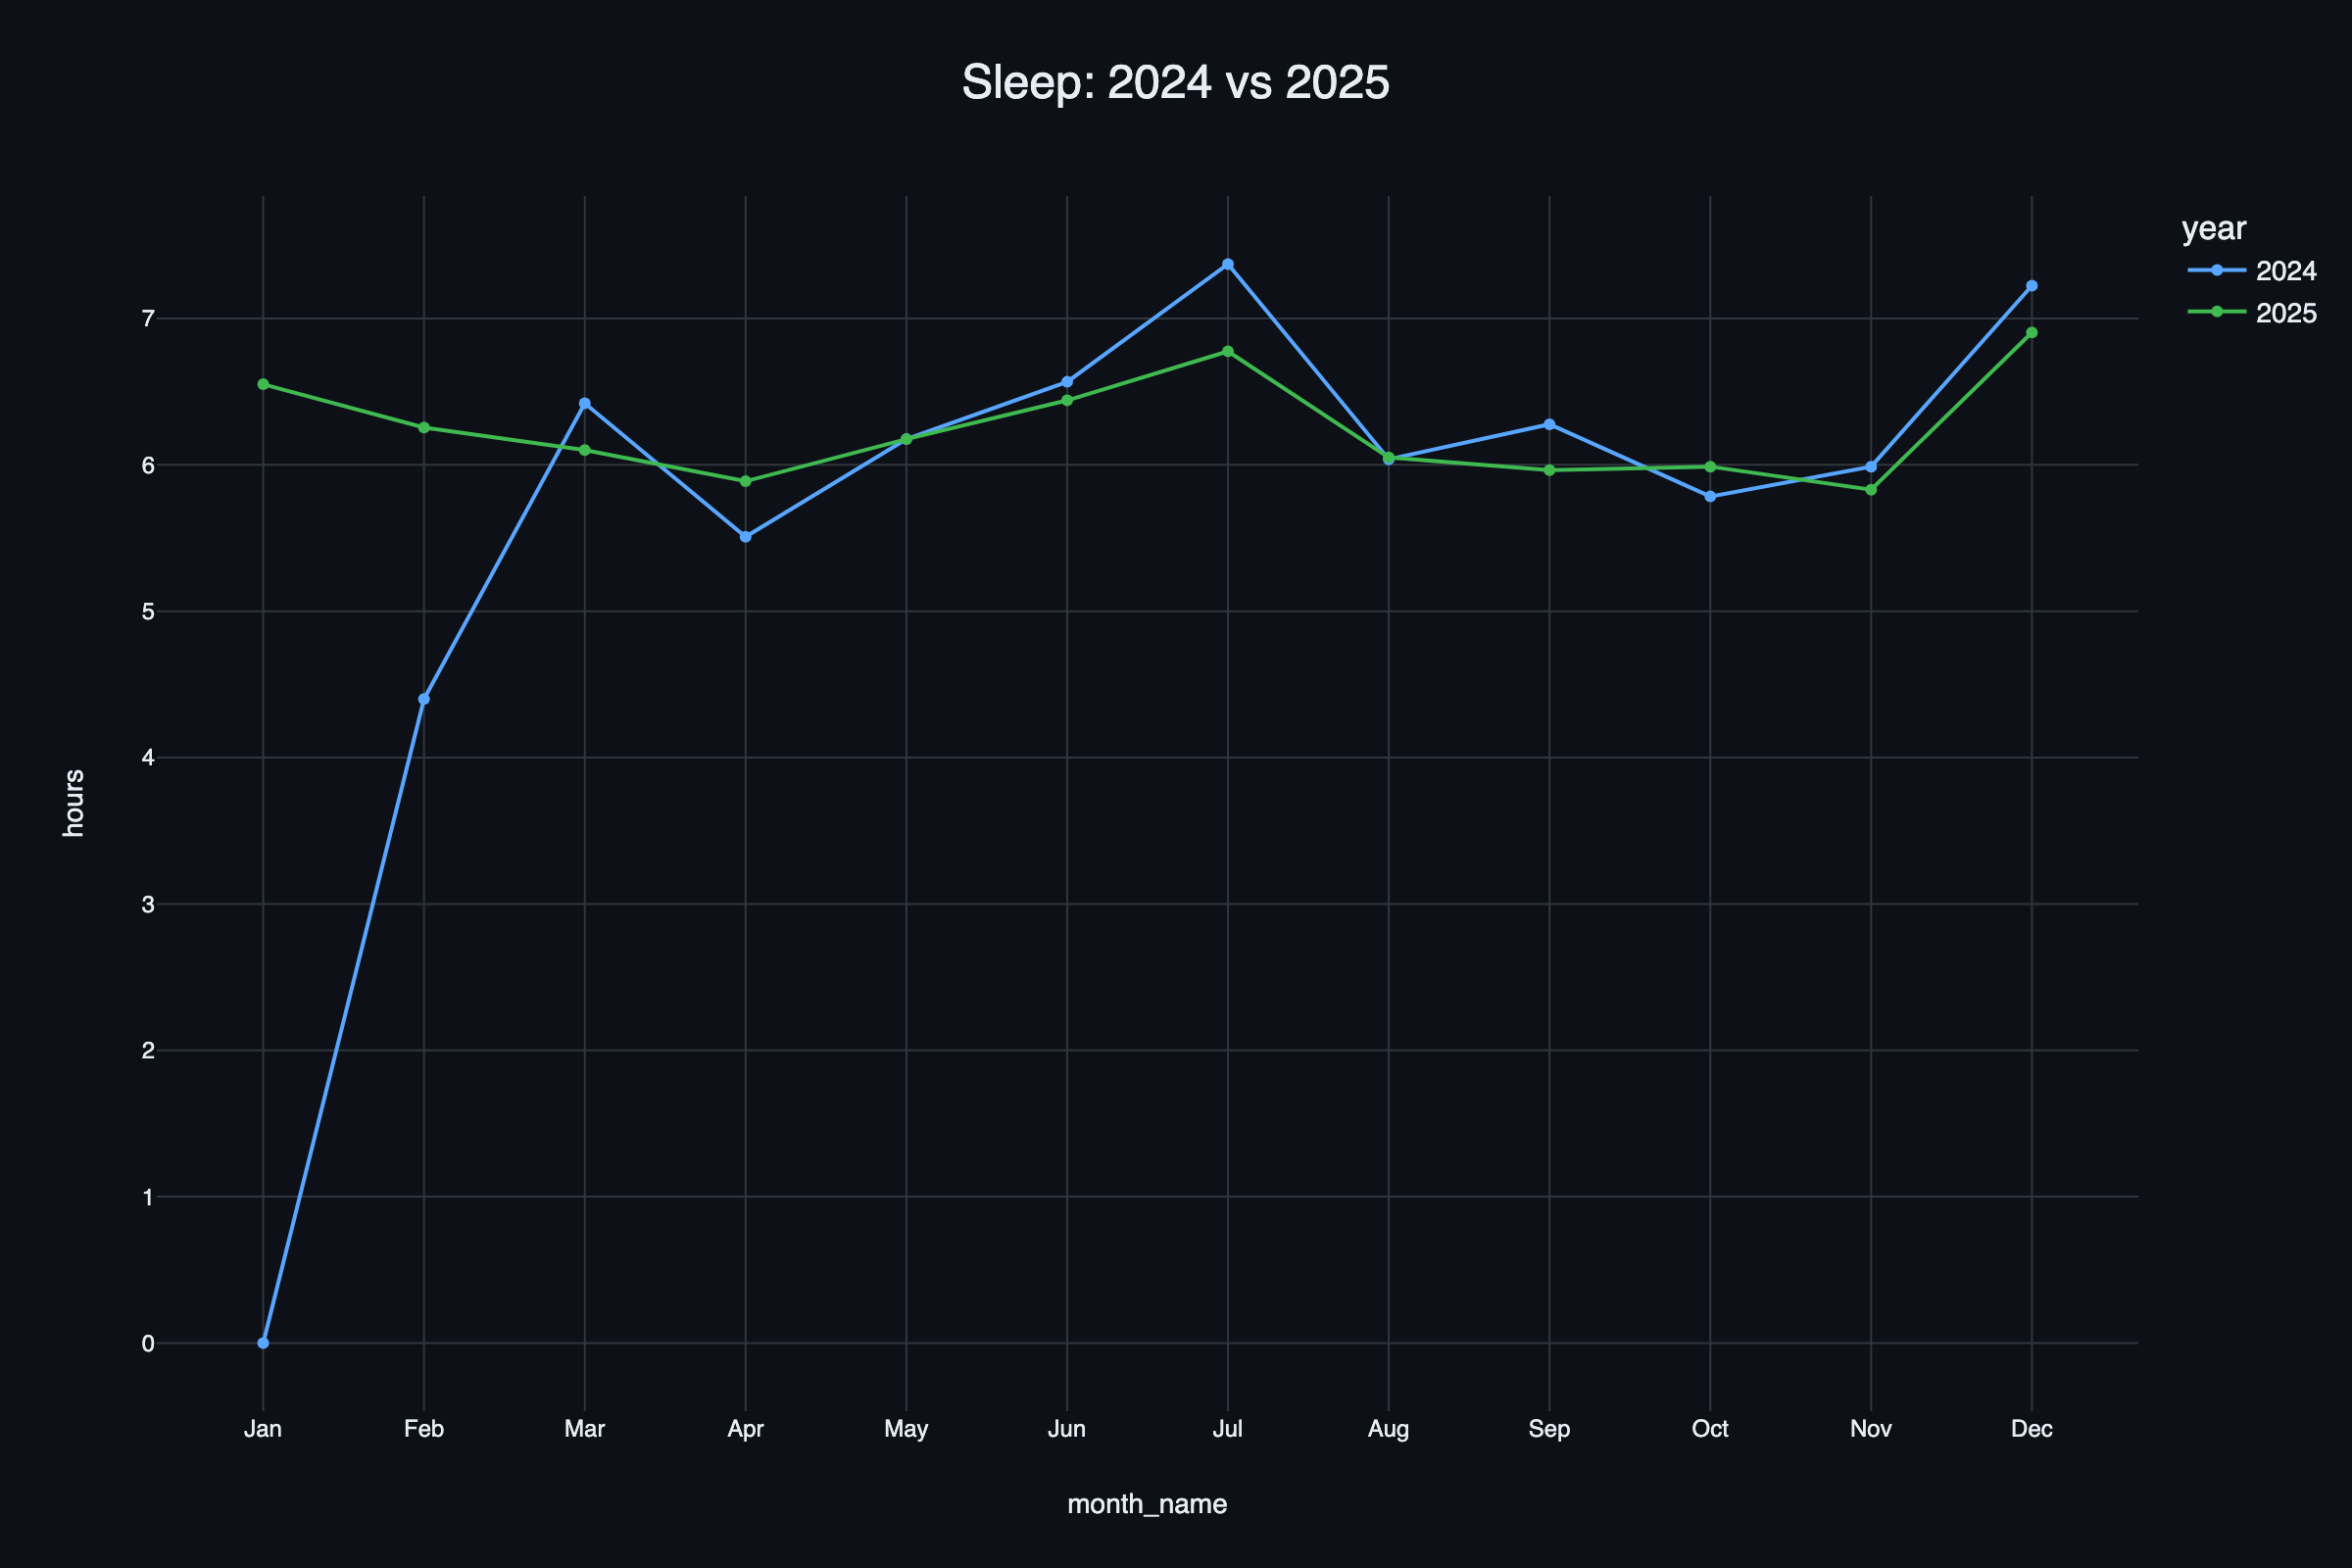
Jan 2024 starts with nothing, not because I didn’t sleep that month, but mostly because I lost the data for that month. But if we look at the rest of the months, the pattern is quite similar: start of the year sleep is in quite a good shape, then the spring session starts and everyone gets busy with work. Then there is the semester-end break, at least in academia, where everyone is taking a break over summer. Then fall starts, workload increases again, and finally the year ends with another vacation season.
Running
At the very start of 2025, I had given a thought that I would run a marathon, but I kind of talked myself out of it. The year I think was fine in terms of running, I just didn’t want to push for another marathon. If we look at the running monthly average data, it’s weirdly fine.
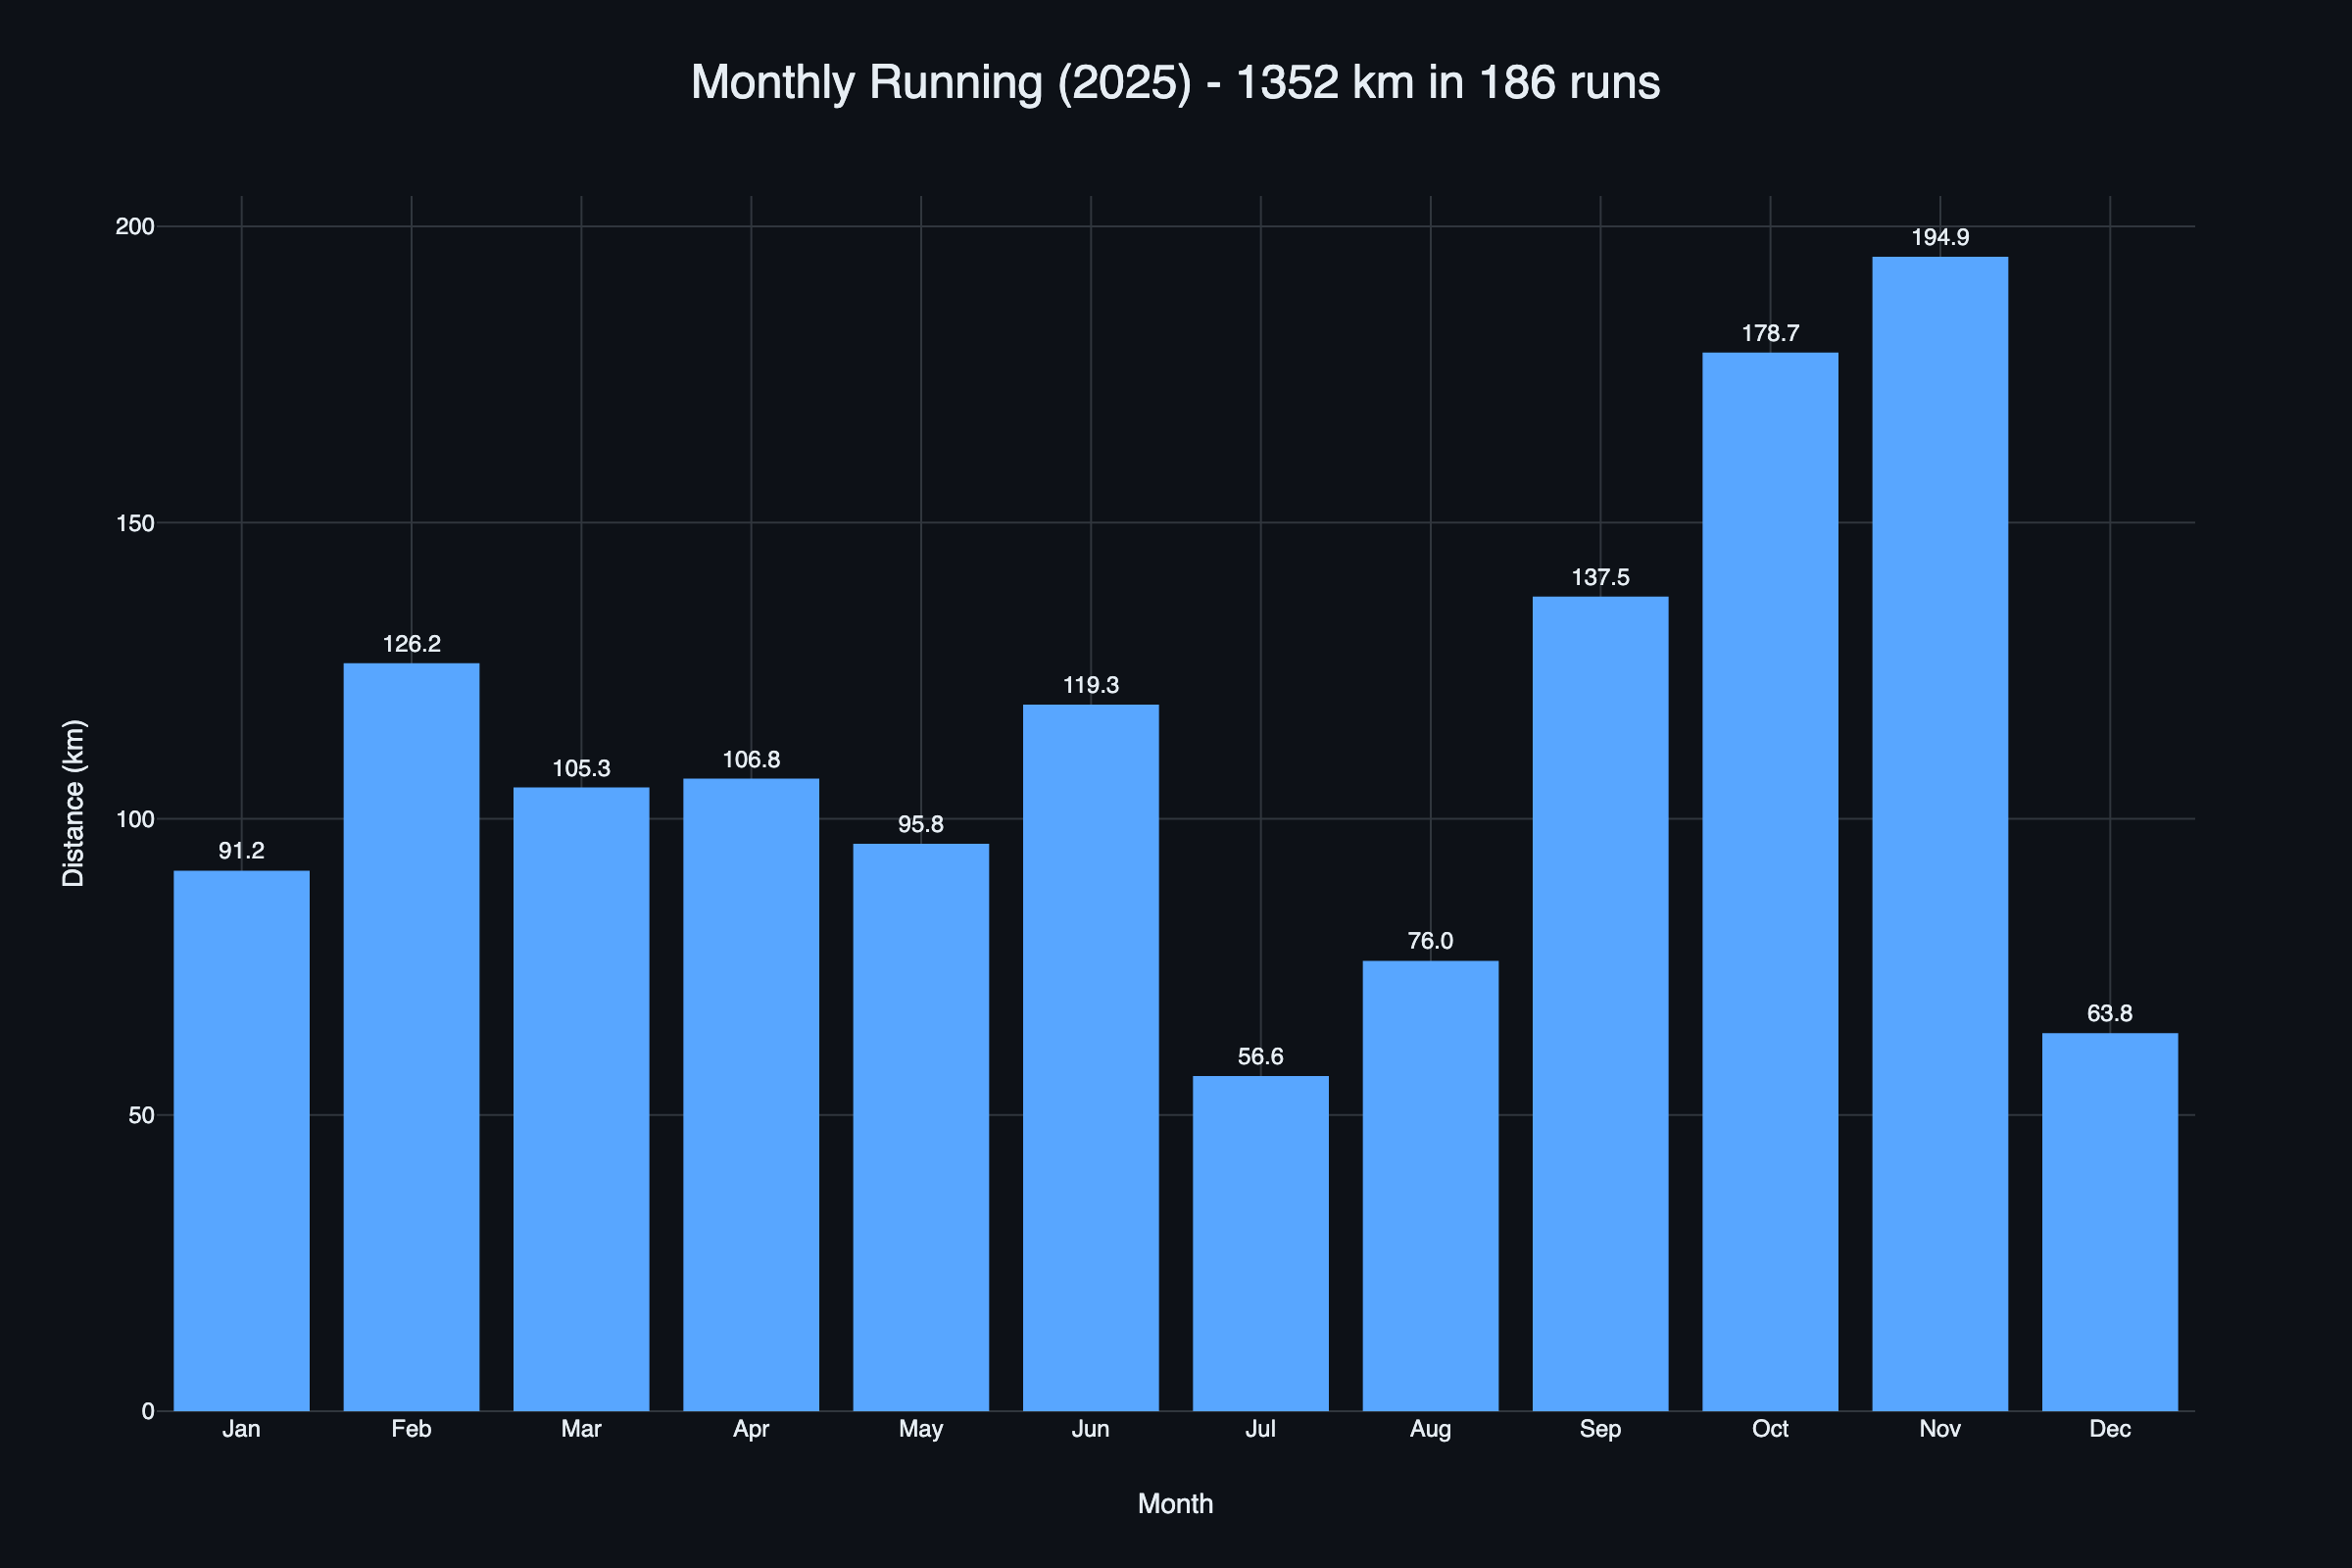
I said weirdly because at the start of the year, I was just running without any proper plan, no structure. I thought if I just ran enough, I’ll stay fit, but the issue with no structure is that some weeks, just because you are feeling well, you go for tempo 10Ks way too many times, and then next week 3K starts to feel like an ultra. Anyways, when July came, I went on vacation, hence July is the lowest. I remember measuring my BMI towards late Aug and realizing things were not heading in the right direction, so I decided to try Runna.
Runna is fine, I guess. The plan that was generated felt nice, but the reason I tried it was that most reviews said it’s good at adapting according to you, which I don’t think was true. It felt more like it took some info and gave me the plan. Again, the plan that I got felt fine, all of my speed works felt good and pushy, the way they should be(?), but again, not an app I want to continue using. I mean a simple HM 10K plan, which by the way looks really simple, helps equally, if not better, I guess. Anyways, getting in the structure really helped me, and well, numbers don’t lie, so each month I was “putting some miles on it (my shoes)”.
This year again, no plans for a marathon. I’ll probably work on improving my short-distance times; getting my 10K time below an hour would be really great, or getting a 22min 5K would be equally amazing.
Movies & TV Shows
This year, I definitely watched way more shows and movies, mostly because several of the long shows (ones that have several seasons and each season has more than 15 episodes) were used as noise while I was doing my work.
I wrote the above paragraph before seeing the numbers, and I am actually surprised.
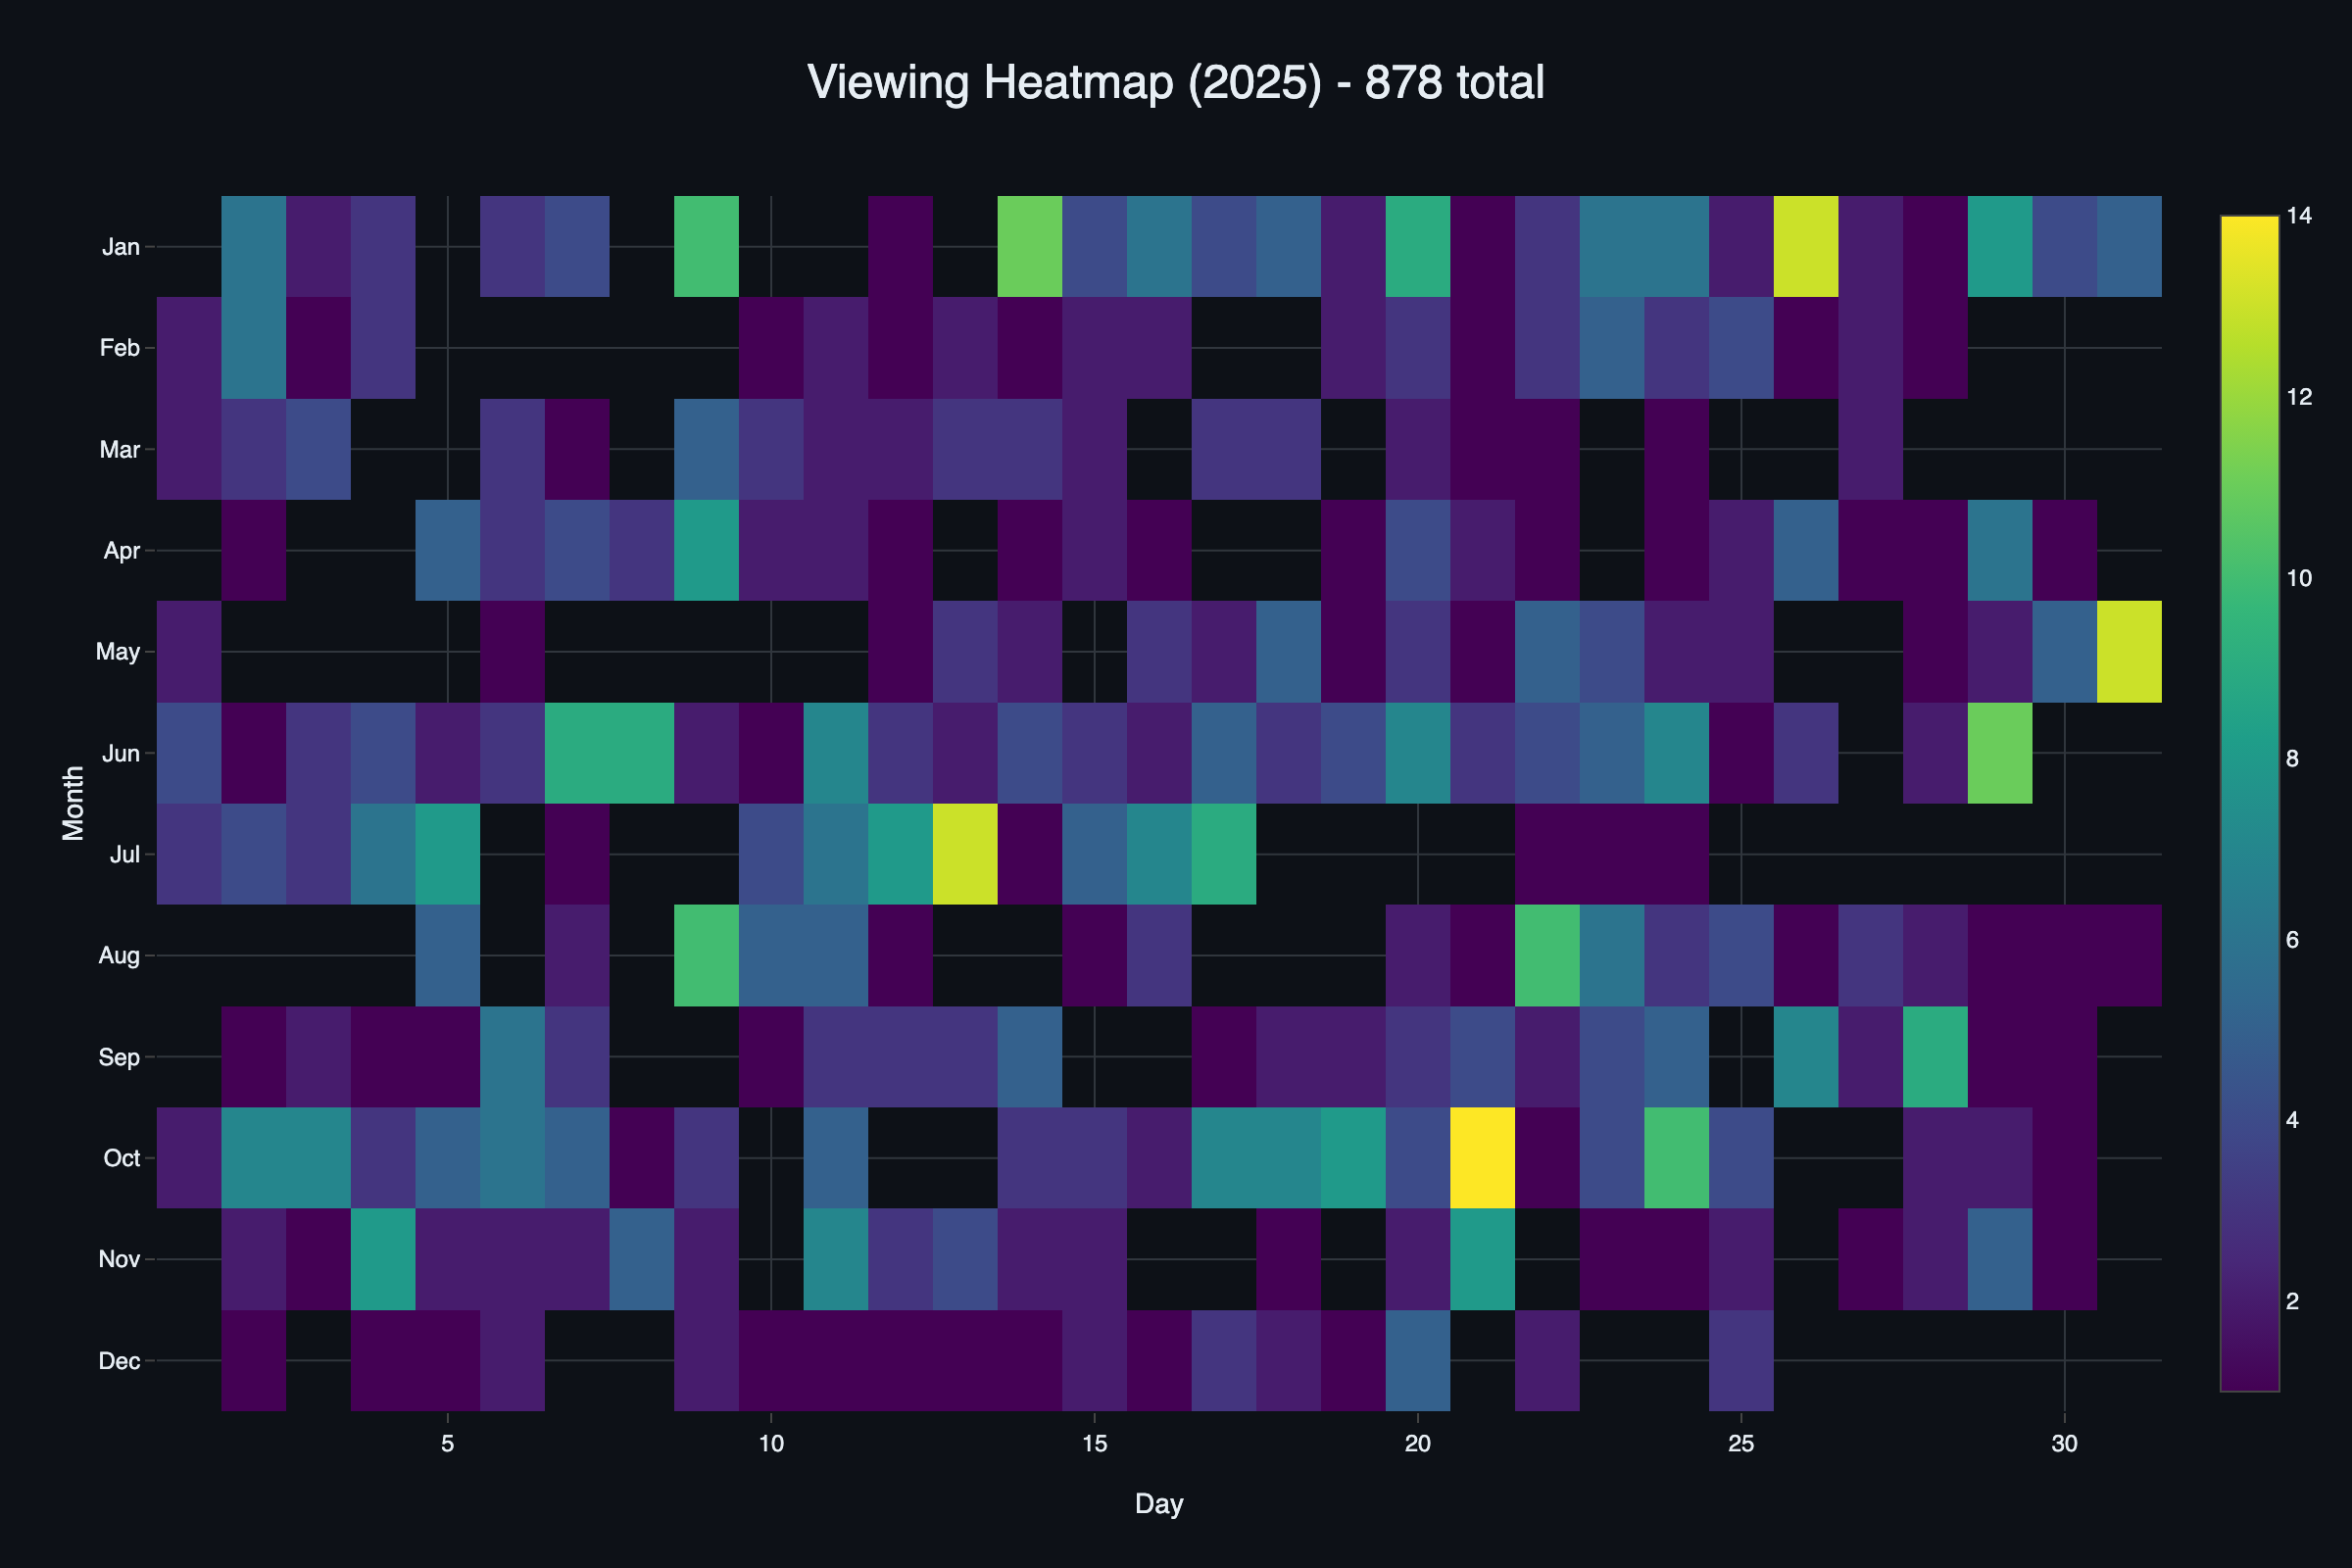
I watched 222 hours of movies and 569 hours of shows, a total of 791 hours, which is significantly lower than last year (I have said those same words last year too).
Wait, looks like I’ve said a lot of stuff in last year’s post, which is true for this year as well.
Most shows served as background noise while I worked. I’d often start an episode, switch to my terminal to run experiments or fix bugs, and only check back when something particularly loud caught my attention.
Yup, this was exactly the case this year as well. But there is definitely one exception this year: movies. In 2023, I spent ~125 hrs, and in 2024 90hrs watching movies. So this year, I was like, “Let’s (re)watch several of the old Bollywood movies.” I had watched a few of them before, but this year was a sort of revisiting of those masterpieces.
Looking at the genre trend for both shows/movies combined:
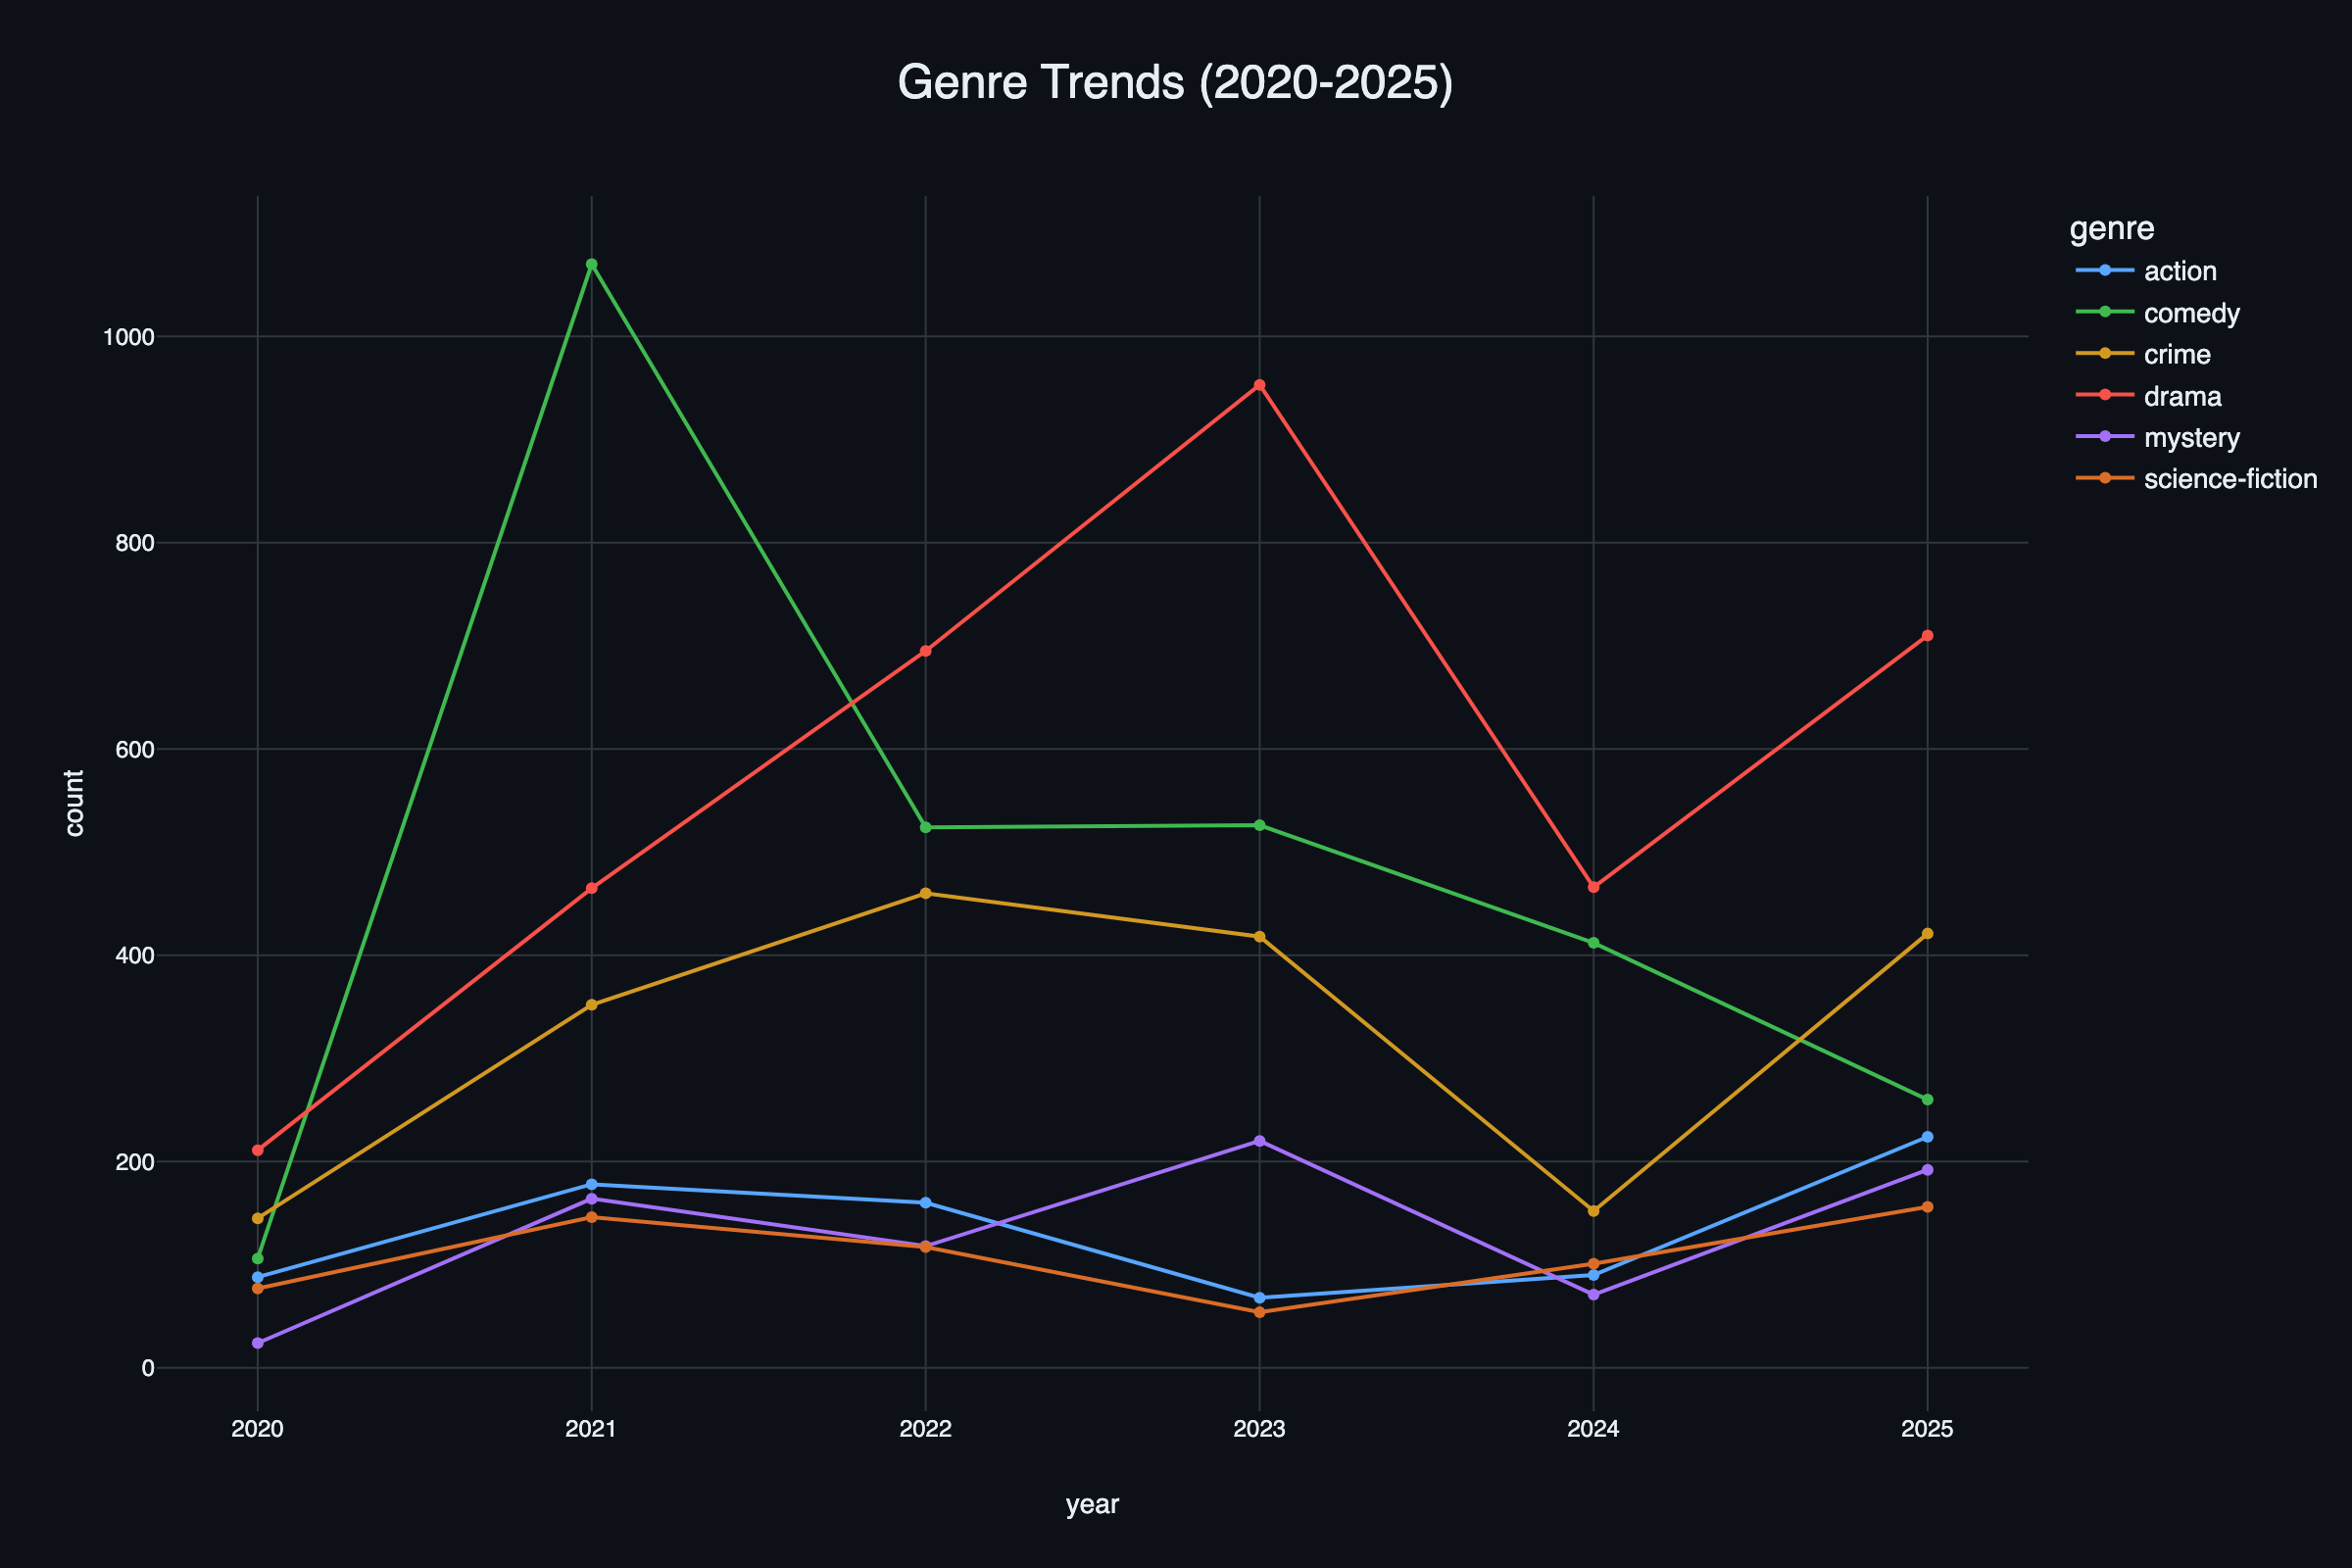
The two big differences from any year are that there is a big drop in comedy and a big spike in the crime genre. Sadly, the comedy genre has been on a downward trend; in the name of comedy, now mostly stand-ups are coming out. The genre breakdown is pretty predictable. Drama and Crime are still my top genres. I blame the algorithms; they know exactly what hooks me.
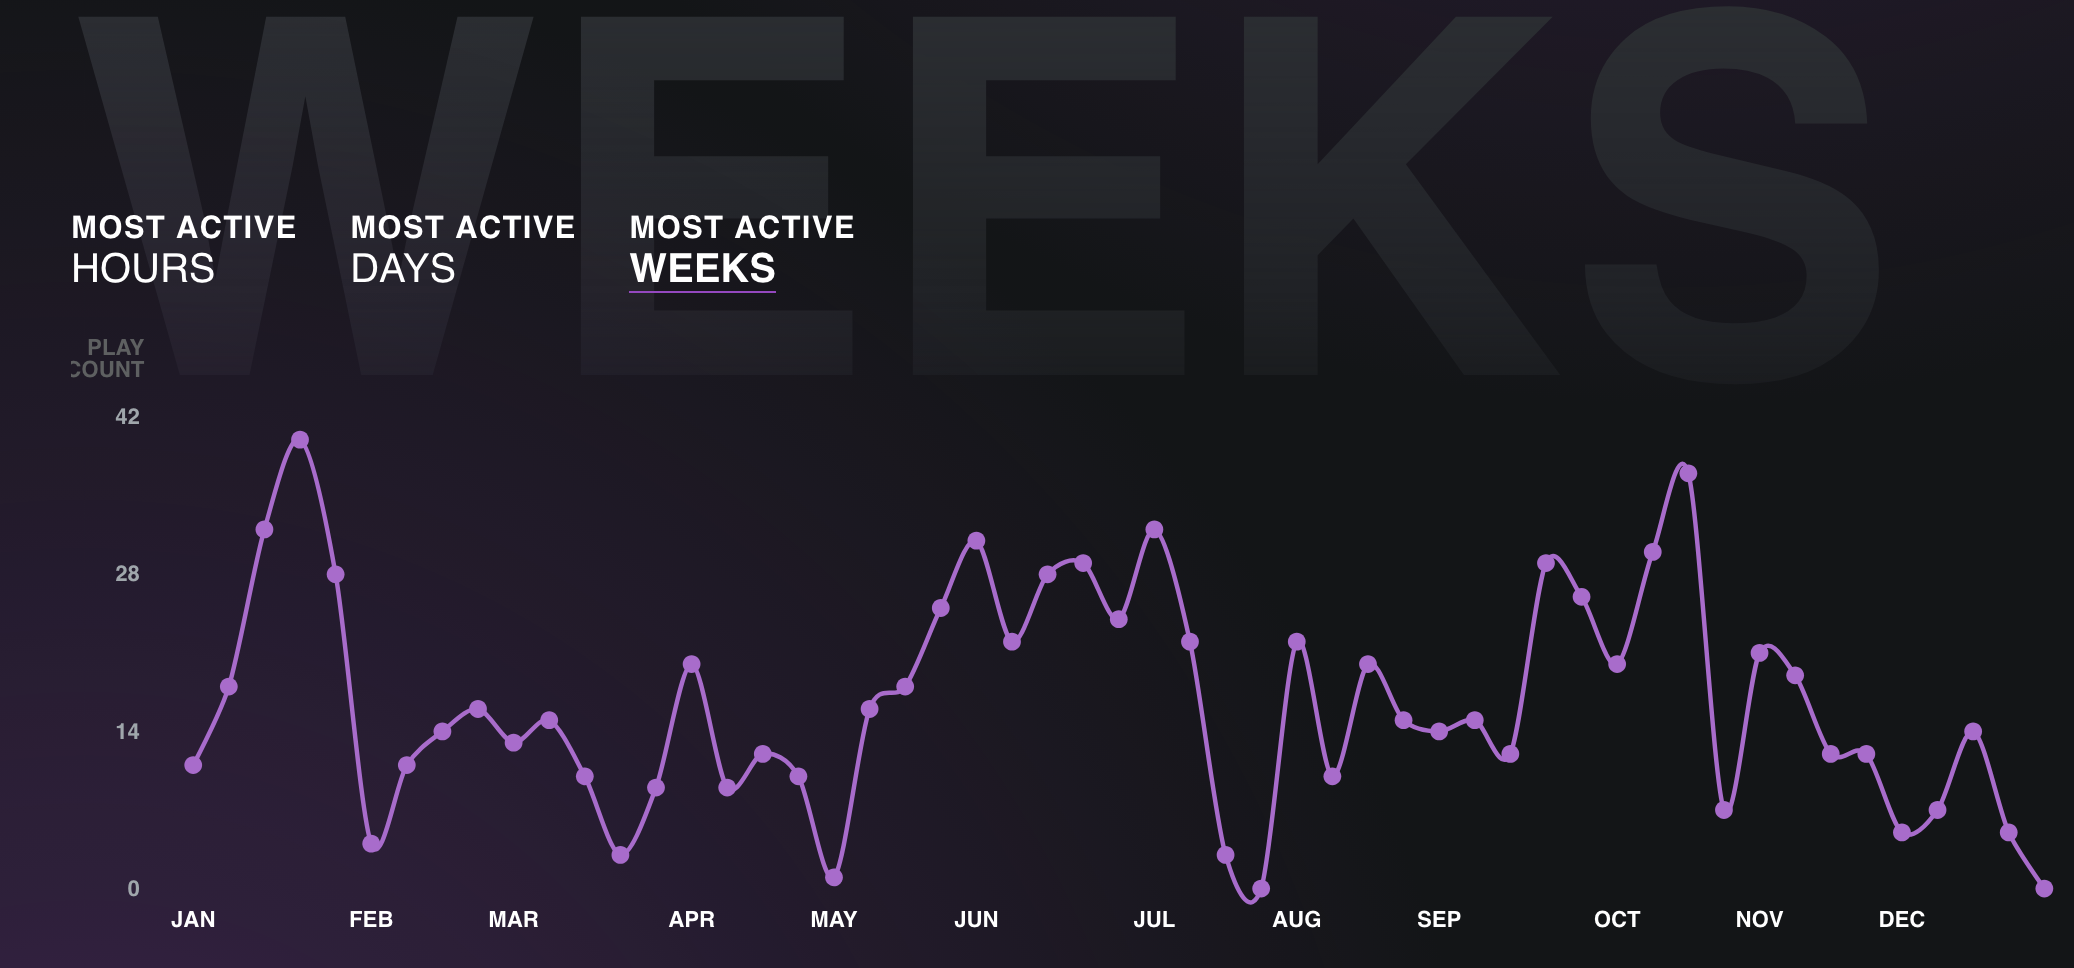
I also took the most active week of 2025 screenshot from Trakt’s official report.
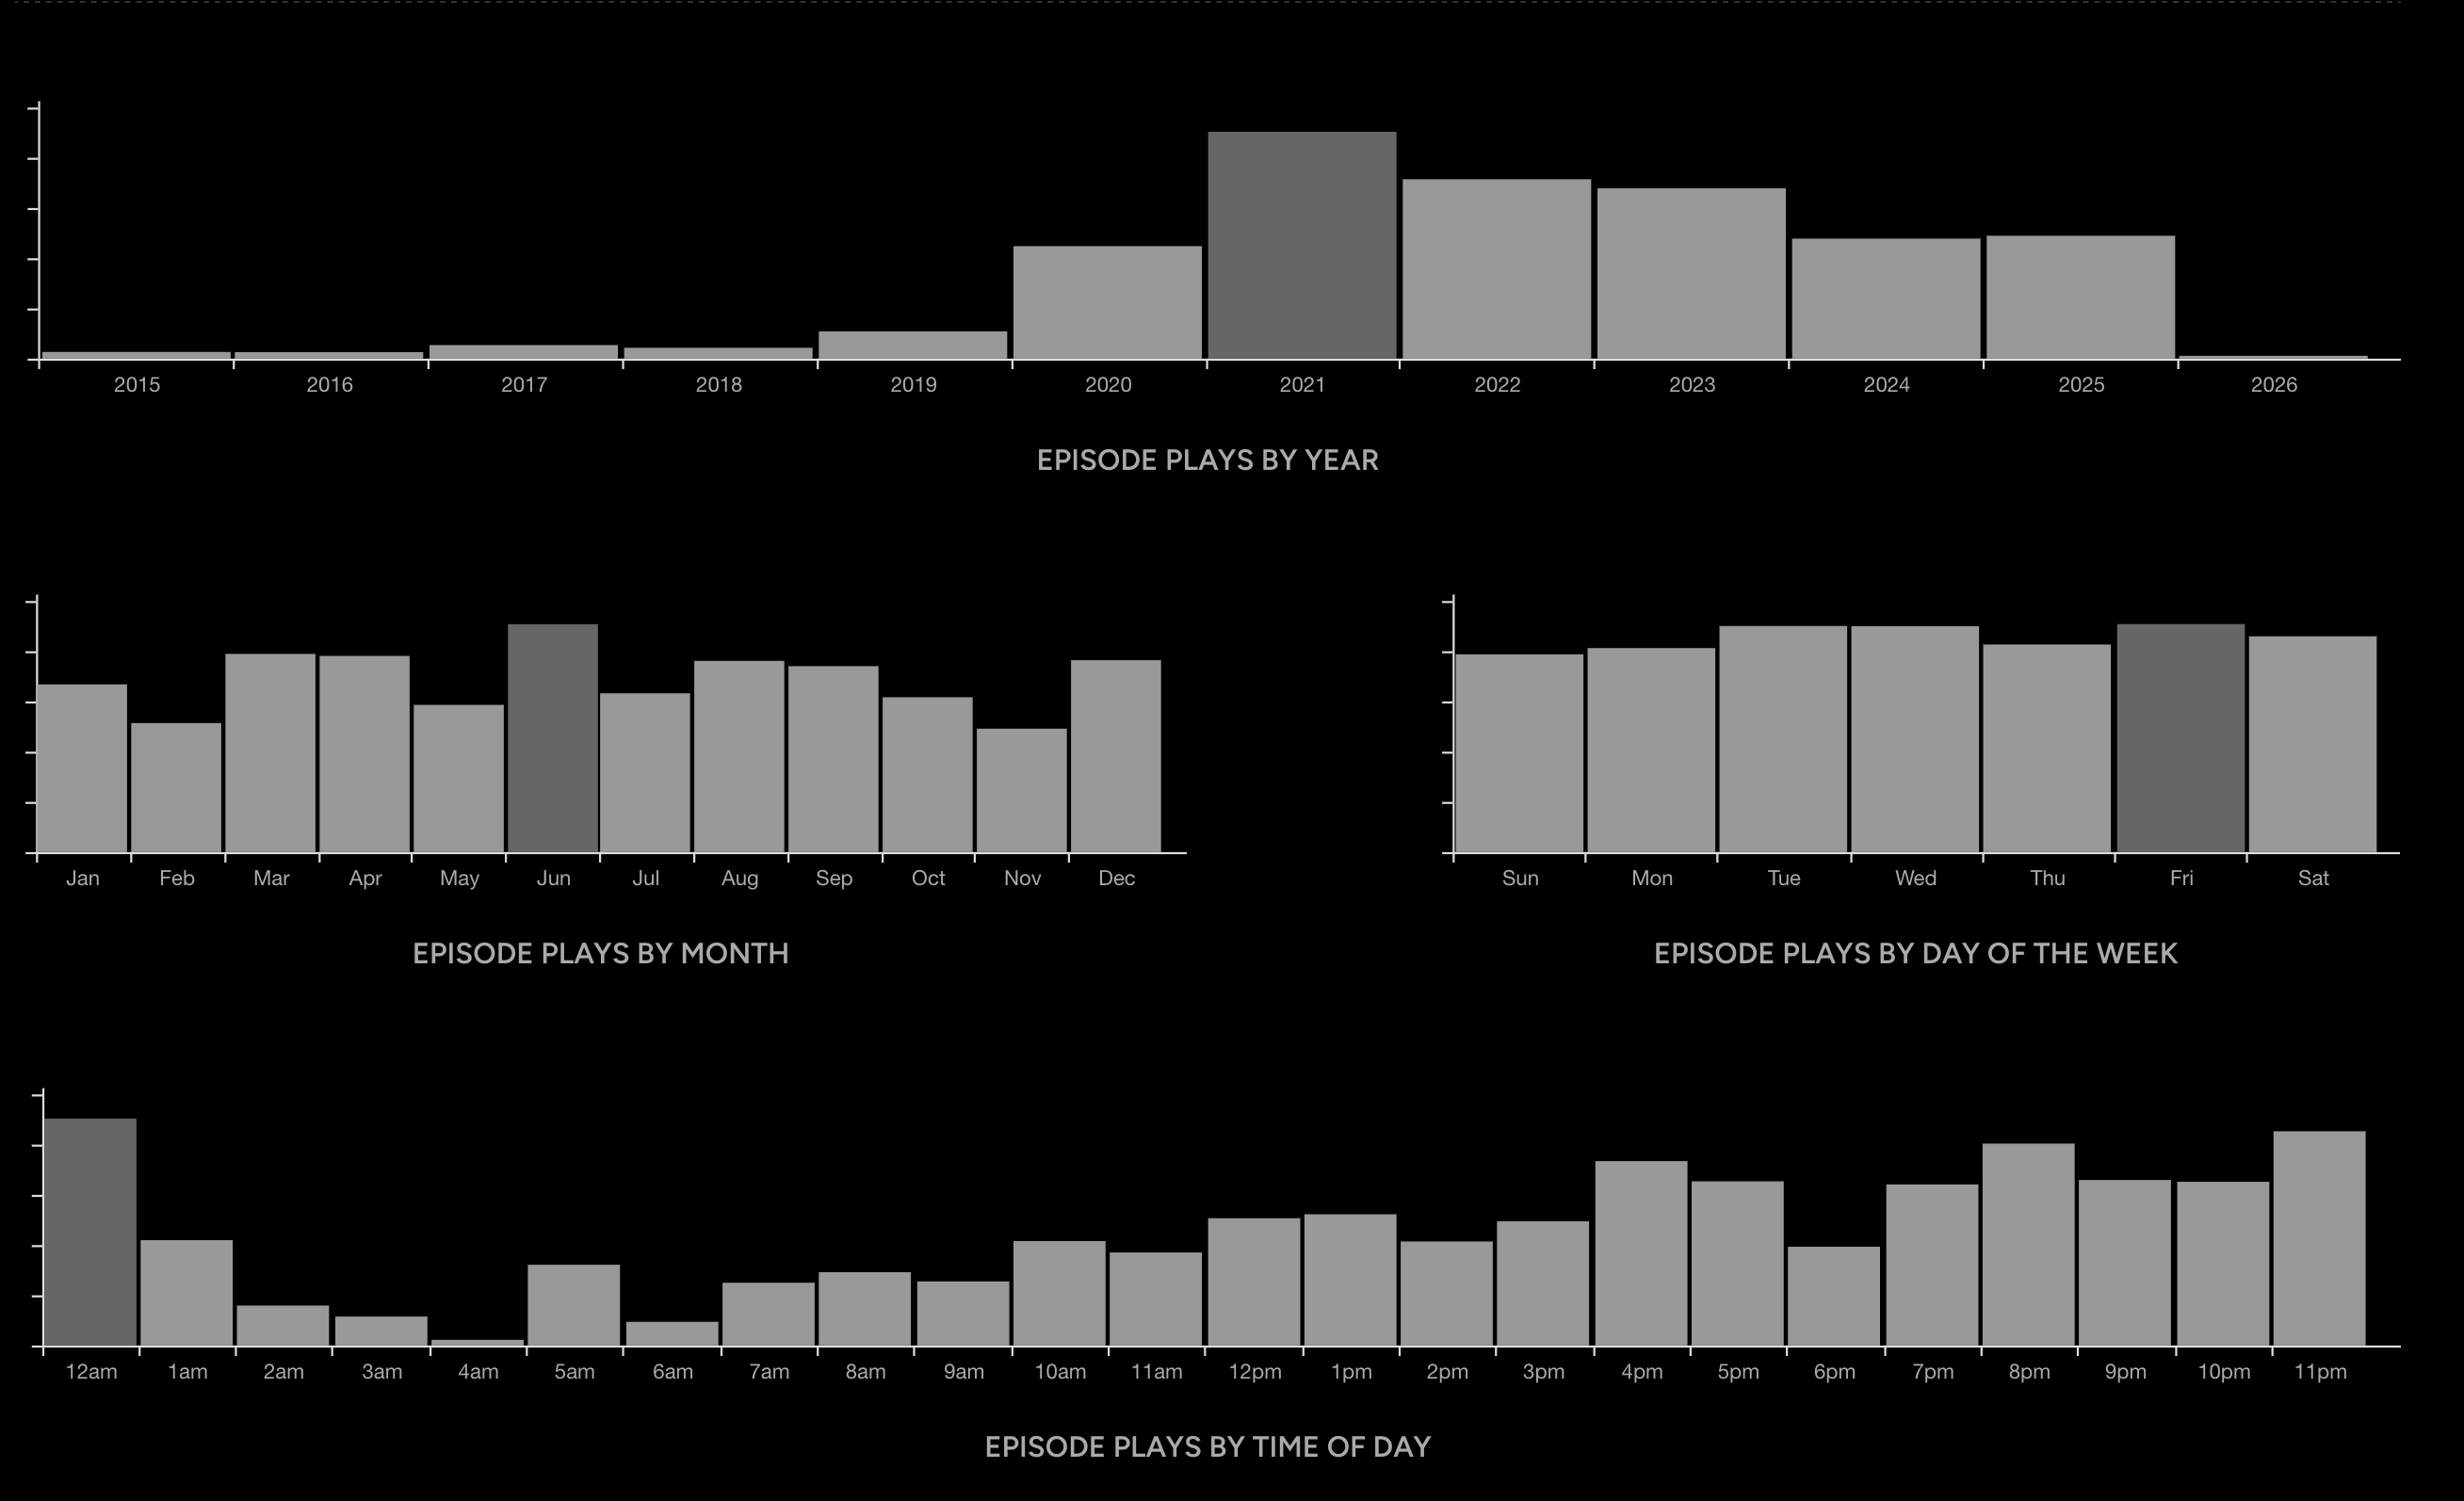
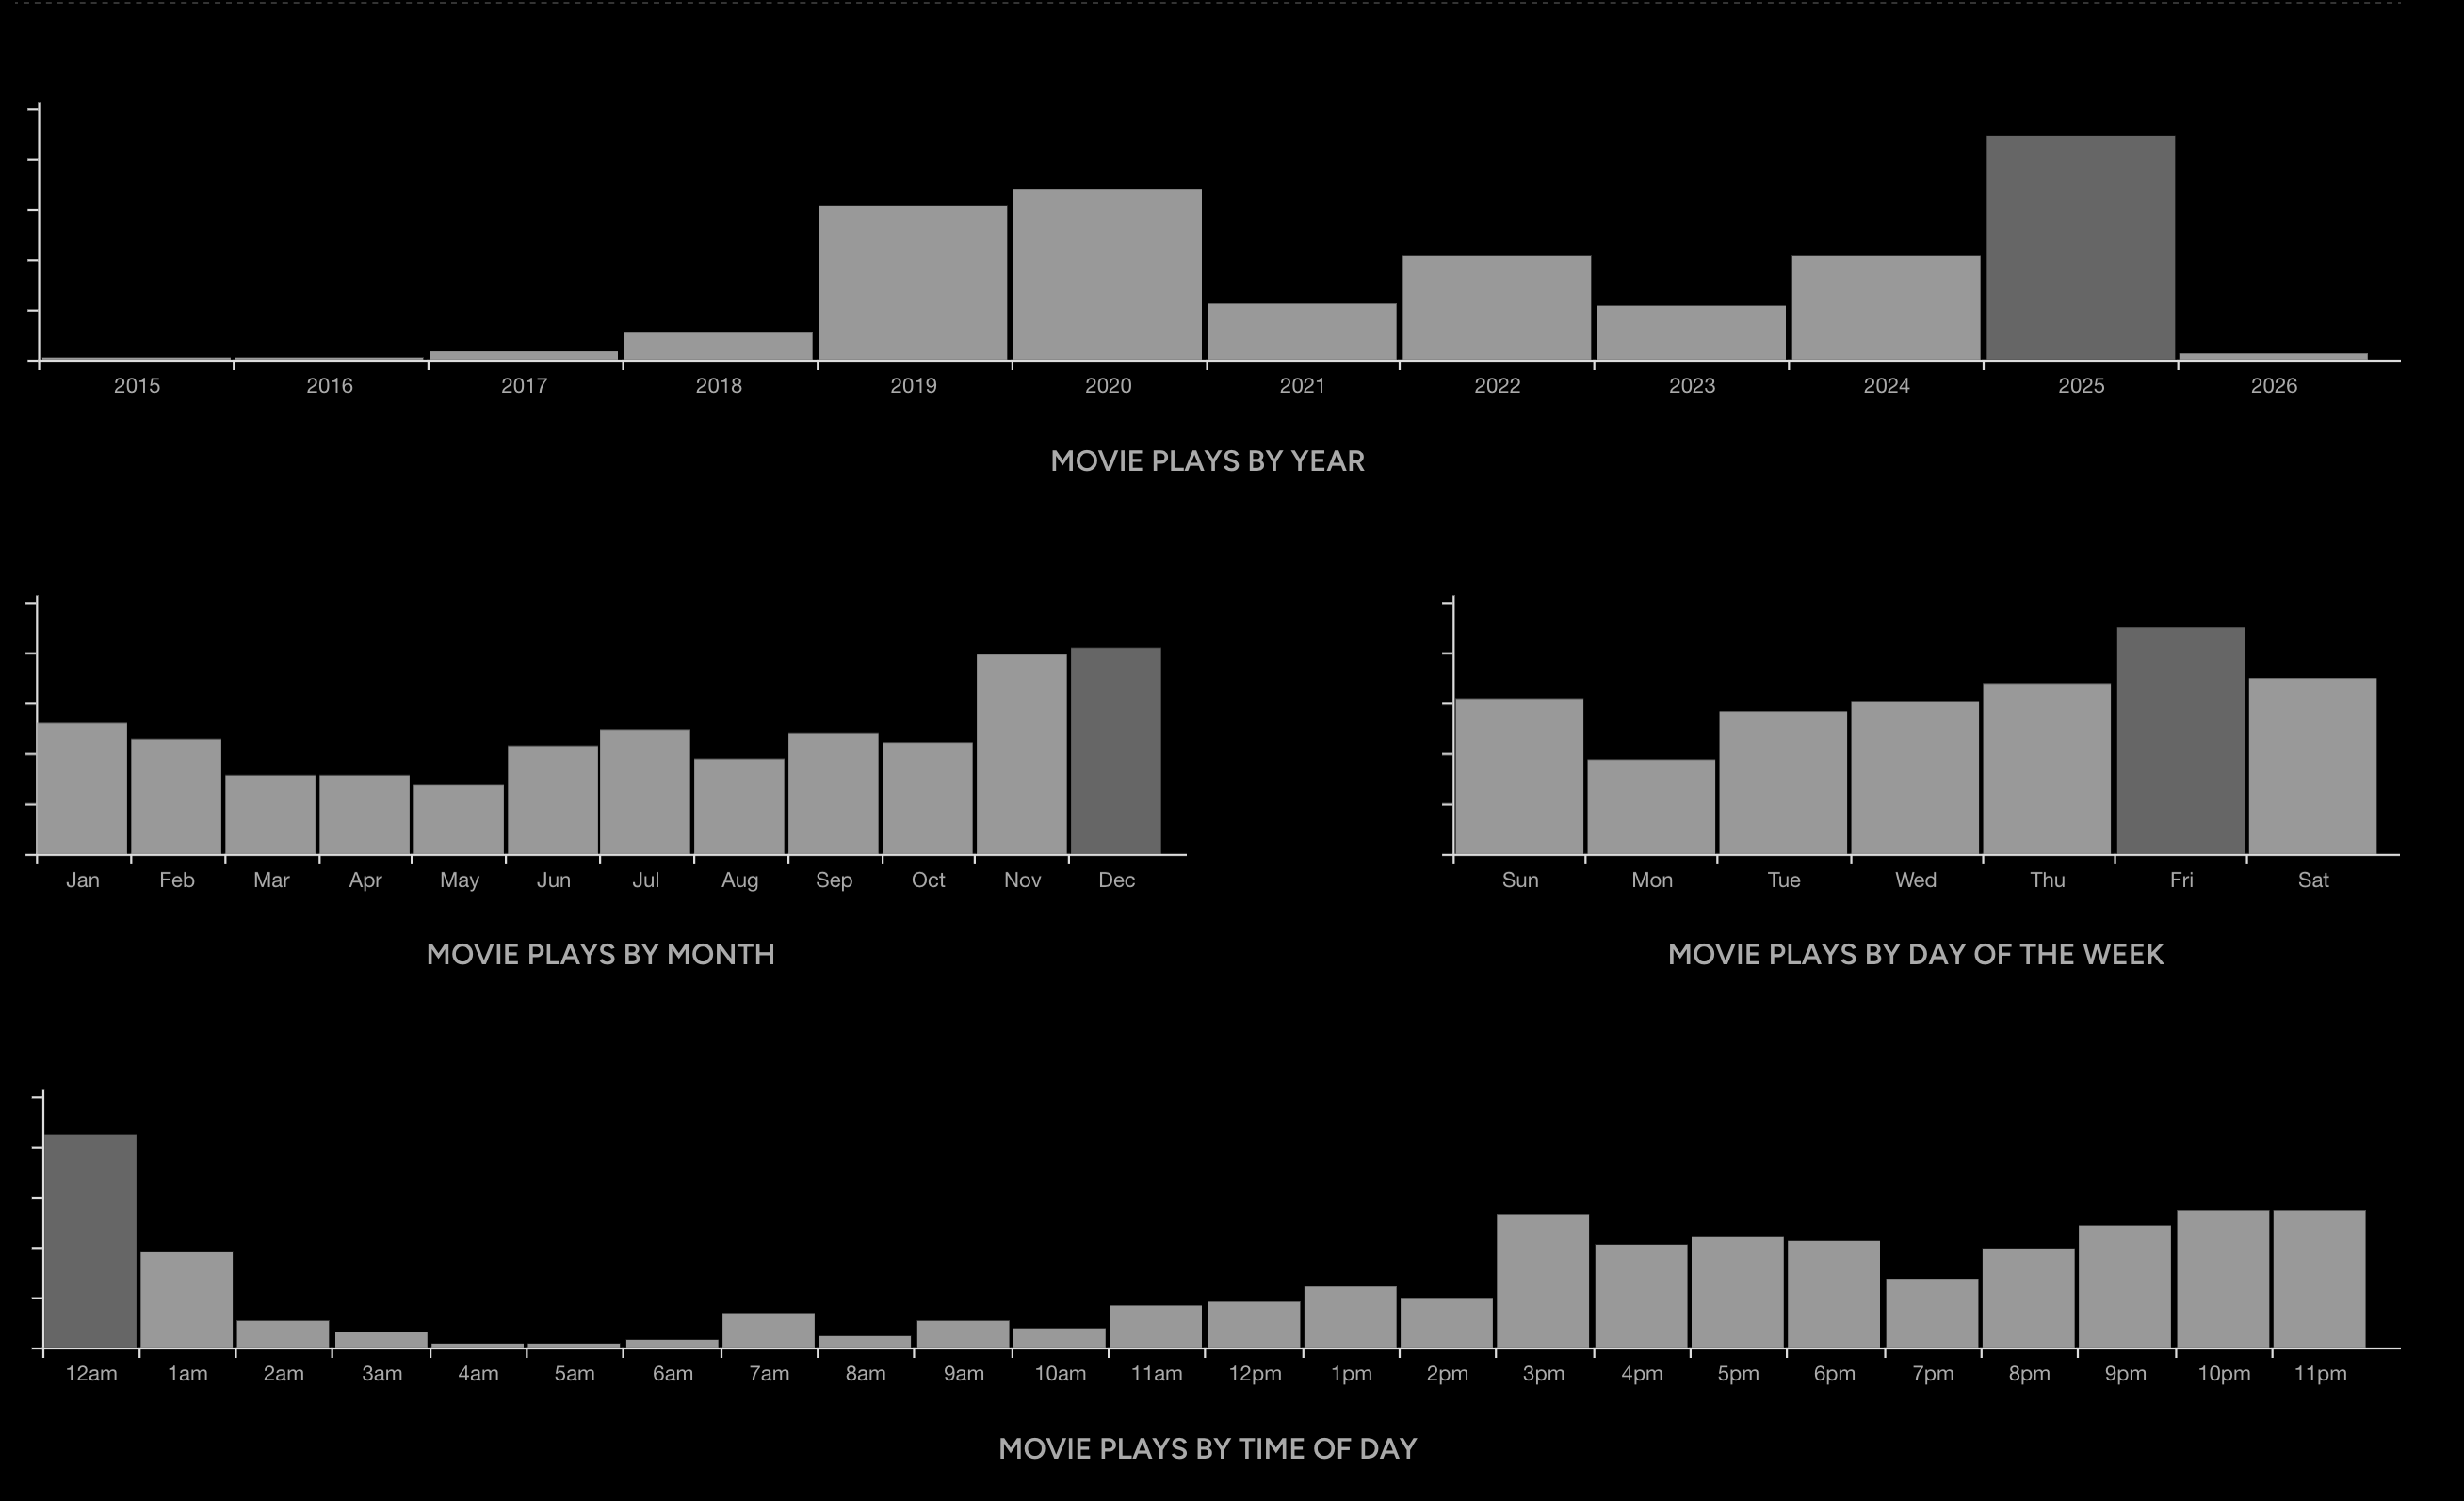
And while doing that, I found the following screenshots from all-time data (I think I started using Trakt around 2015):
Top Show of 2025:
- Mobland
- The Diplomat S3
- Daredevil: Born Again
- Slow Horses S5
- The Bear
- Severance S2 was fine for me.
Movies: According to Trakt (yes, I am still using that), my top 10 movies of this year were:
- Good Will Hunting
- The Lunchbox
- Kapoor & Sons
- Mud
- Ittefaq
- Django Unchained
- The Two Popes
- Wake Up Dead Man (Knives Out)
- Swades
- October Sky
Music
This year, I got rid of Spotify. It was frustrating to wake up, and every day you would see several of the songs being gone from the list for whatever geopolitical reasons. I’ve gone back to my roots, self-hosting and scrobbling to Last.fm (continues to be one of the best freemium services).
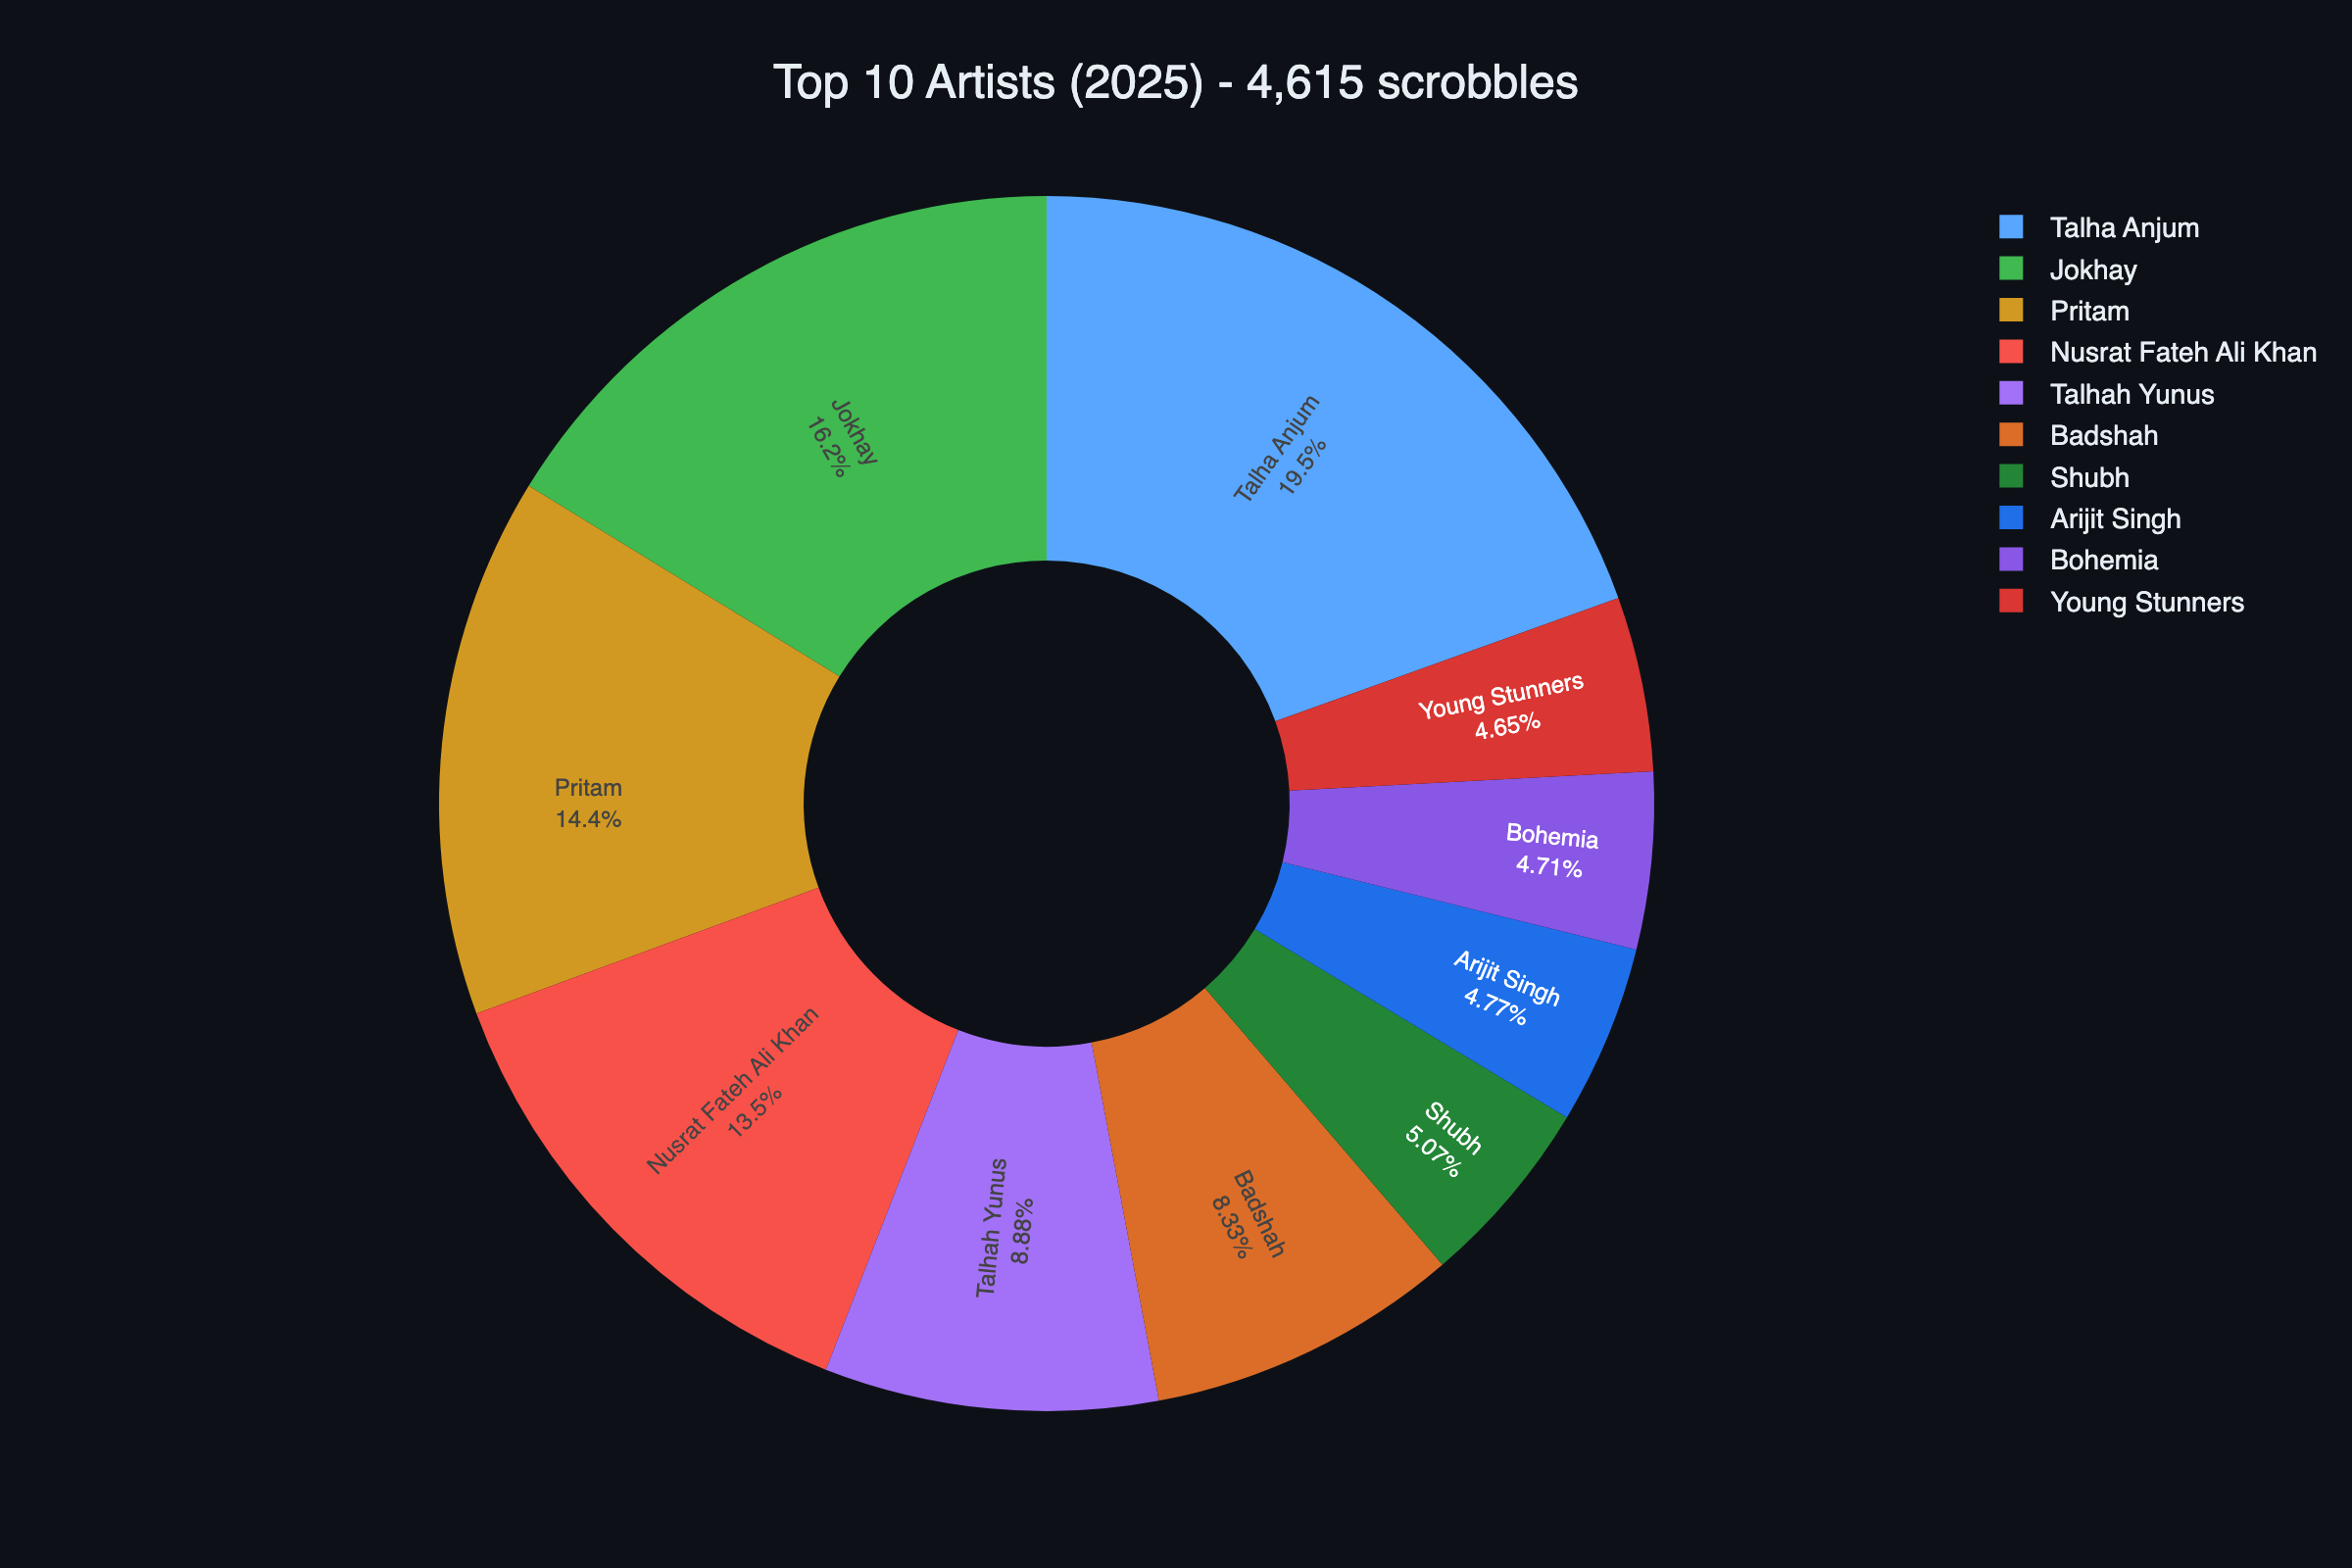
The good thing is that my top artists haven’t changed much, and the bad thing is that even their new songs aren’t as good as their old ones. So my playlist still contains several songs from the above artists, but released in 2024.
The artists and this year’s song might not have been fun, but it’s always fun to look at the listening clock.
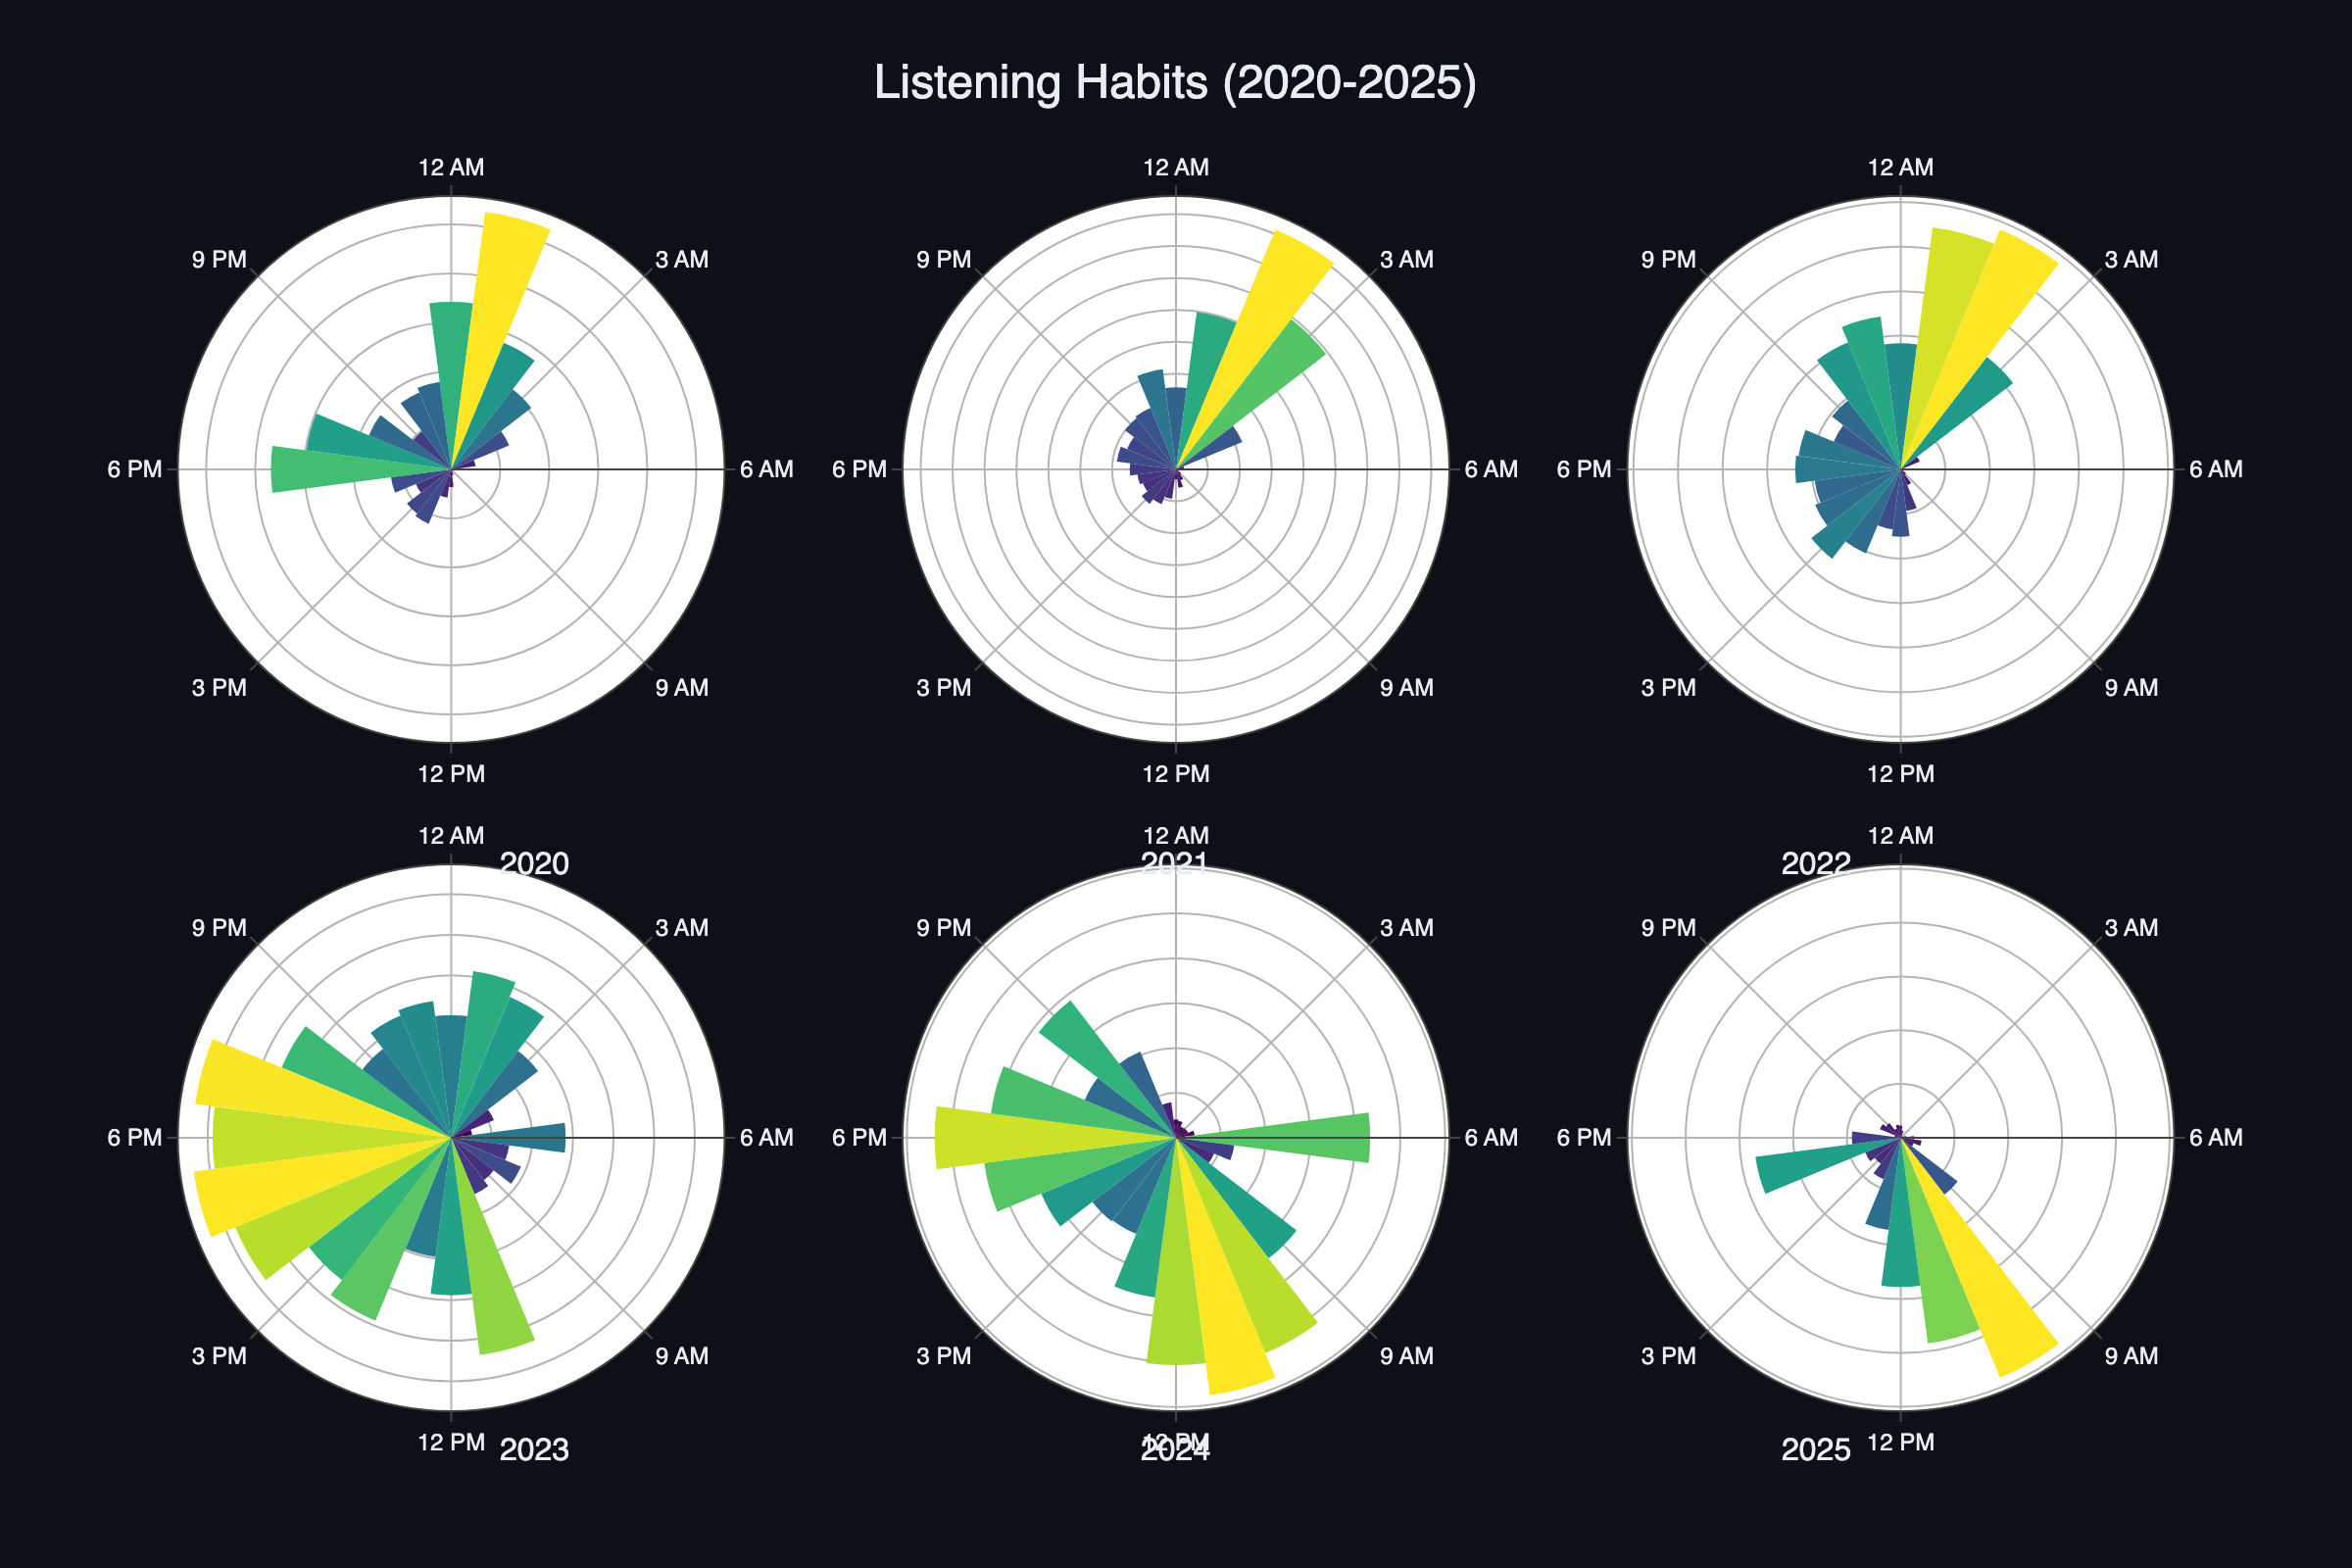 First things first, I am happy that I have enough data that there are 6 clocks now, and the image looks even (unlike last year’s image). It’s nice to see a pattern, how things change, and how we adjust accordingly.
2020-2022 was like the end of my bachelor’s and remote work year for me, and also covid & early post-COVID-19 years. Life was sort of different; I was listening to music at night and either playing RL or working, hence all the clocks show peak hours to be early mornings.
Then there was a transition from remote work to master’s, so in 2023-2024, we see most of the peaks to be around brunch time or in the evening. Basically, while going to college, some classes were in the morning, some in the evening. And then this year, working solely as RA, most of the listening time is when I’m traveling and a little bit while trying to kill noise in the lab. We do see a small peak around 5-6PM range, which again is coming back home from lab time, though this year that time was a variation of either music or just reading RSS feed.
I was looking at the Last.fm official yearly recap data and found the following data interesting.
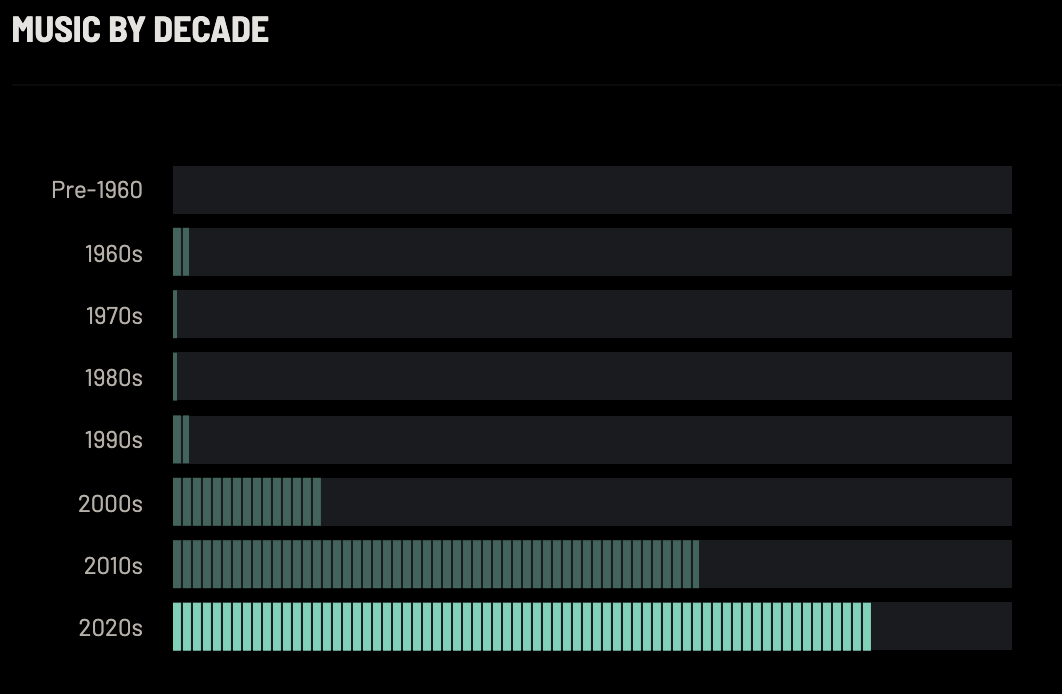
Reasons for those decades:
- My most replayed songs are Hindi/Urdu hip hop songs, and they are from 2020s.
- 2010s because Atif Aslam + Arijit Singh. Also Pritam and all, though their footprint in my library is smaller than first two artists.
- The 2000s cause Lata Mangeshkar, Altaf Raja, Jagjit Paaji.
- And I’m guessing here, but all the 90s are actually all the qawwali, though I’m not sure.
Another thing that I’ve done this year is a sort of correlation graph. To see if I can get more information out of the data that I have. So, to start, I decided to see which artist I listen to while doing what.
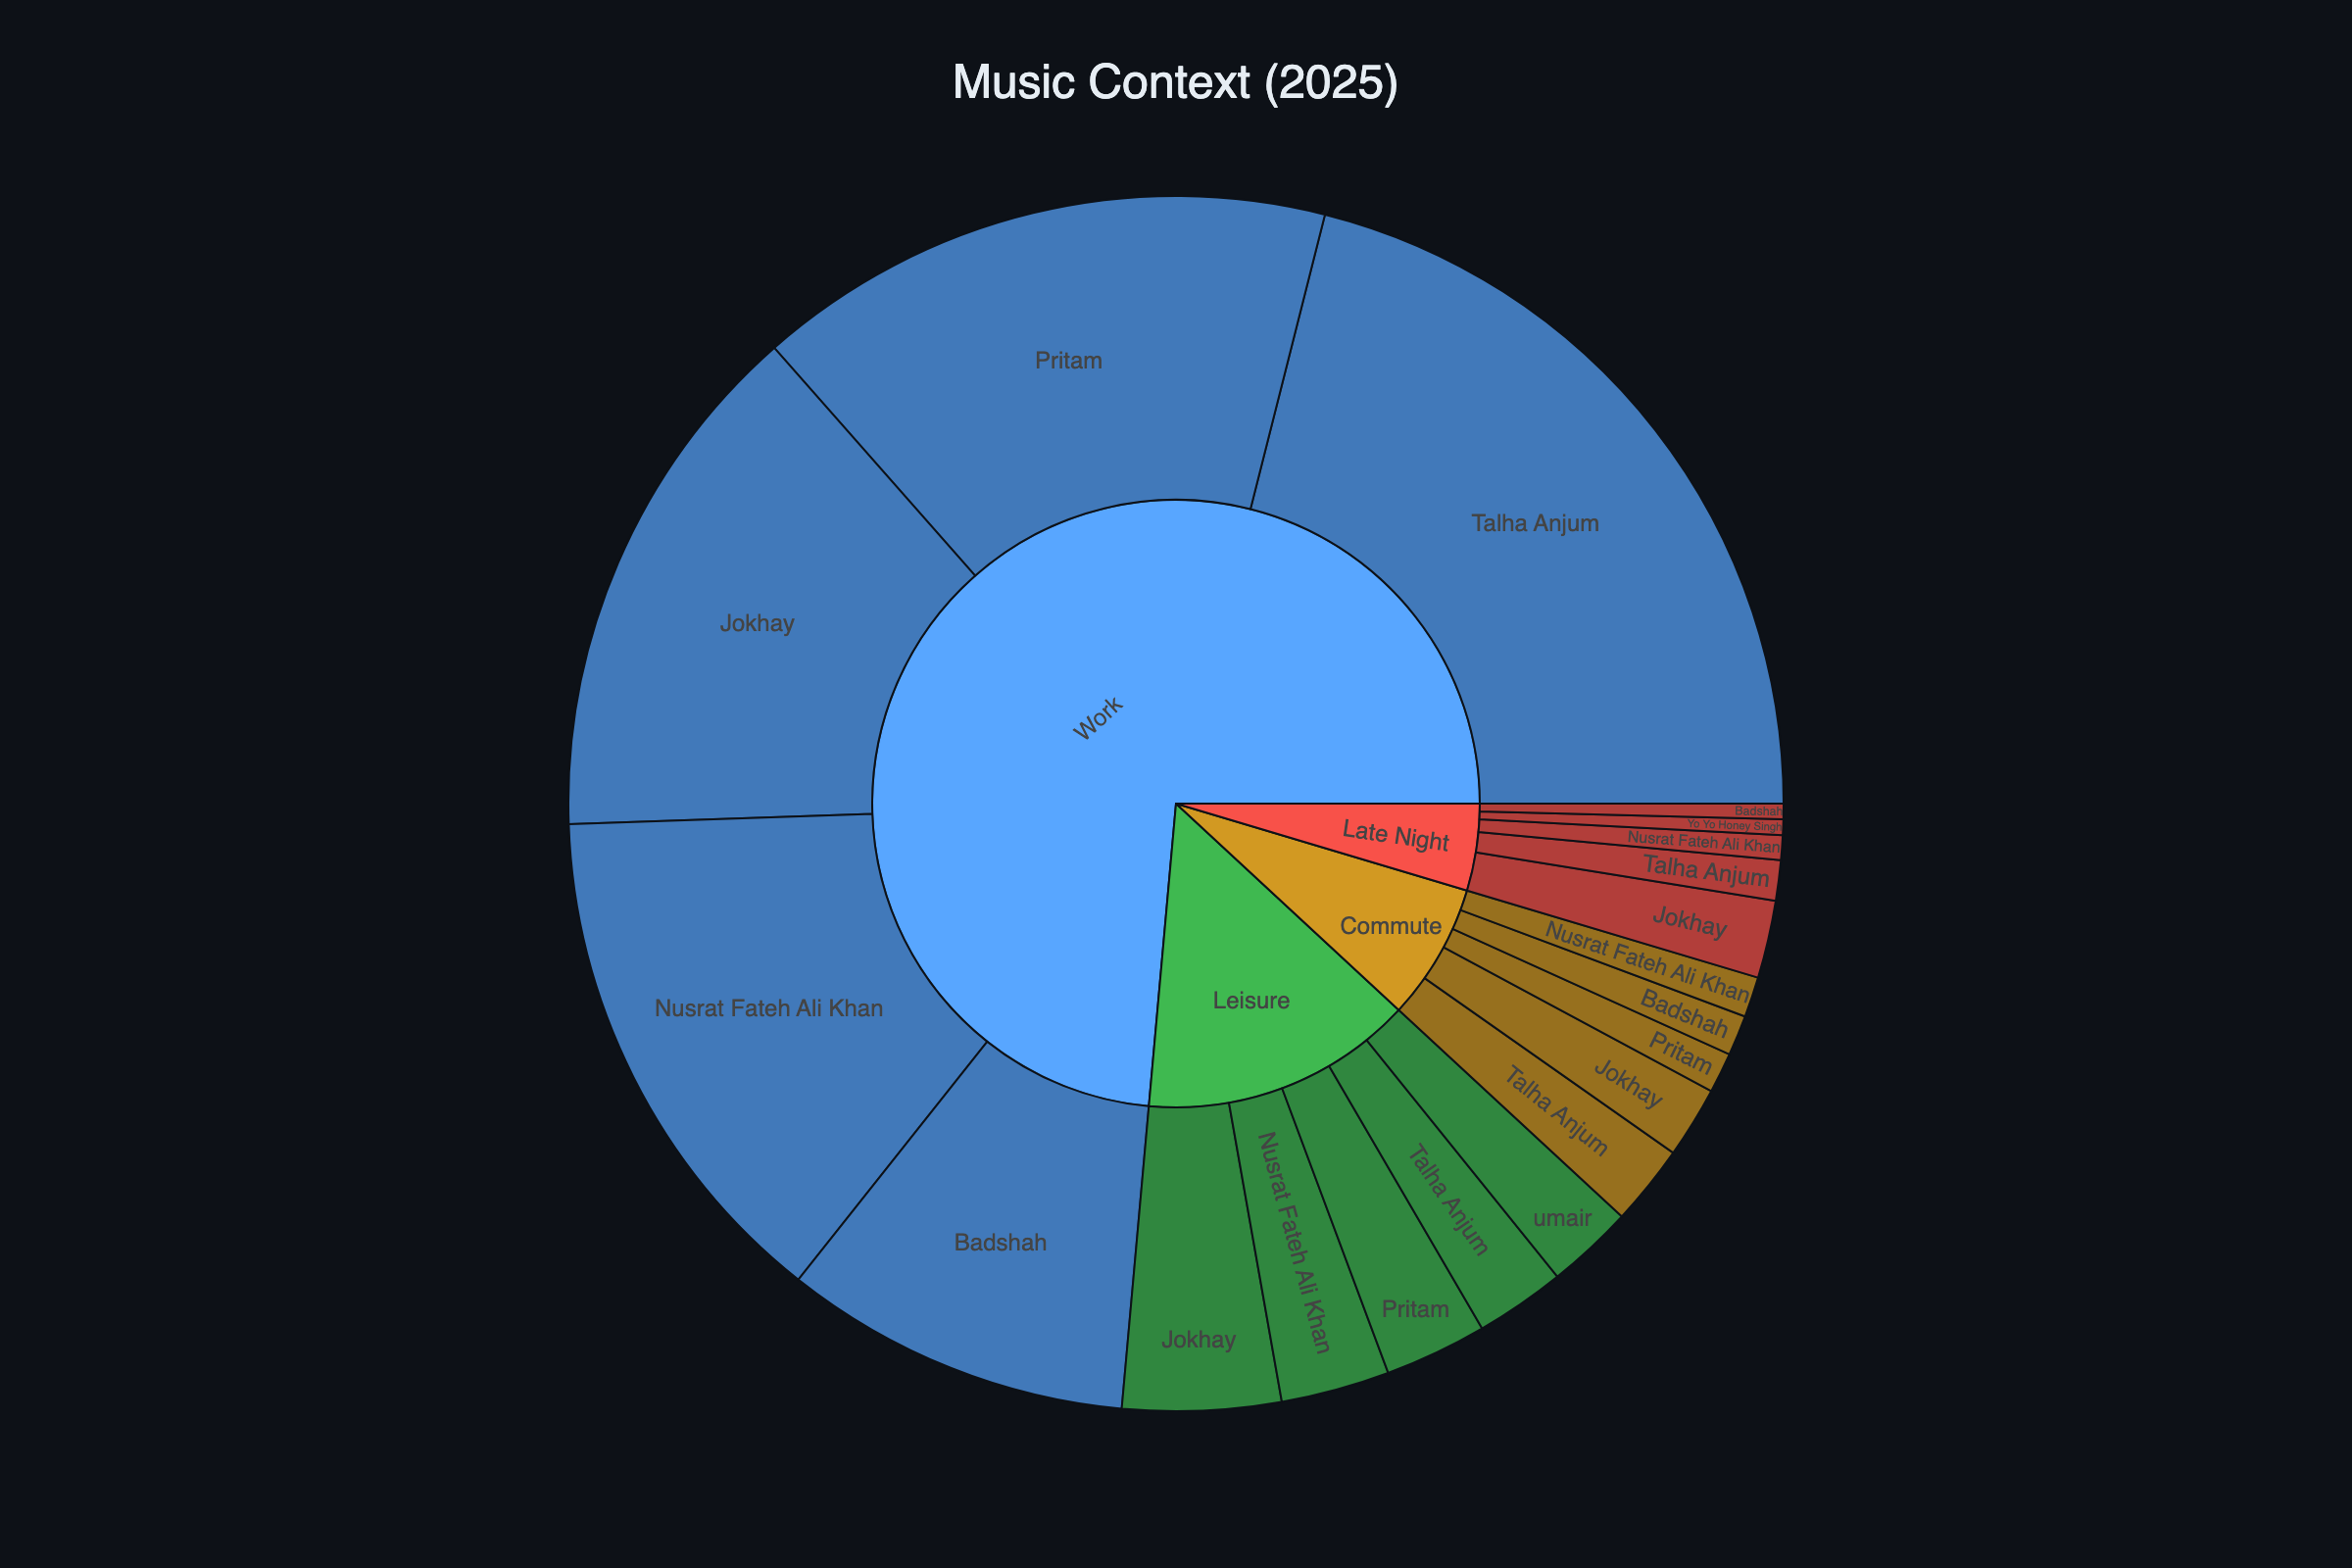
But looking at the graph I realized, for almost everything I am listening to the same songs.
Reading: Books & Articles
I don’t even remember why I moved away from Goodreads to StoryGraph but that’s what I’ve been using lately. And since I had my doubts even before Pocket was killed, I had transitioned to Instapaper. My experience with both of those websites has been great.
At the start of February, I set the goal to read 25 books this year, and that goal went pretty well.
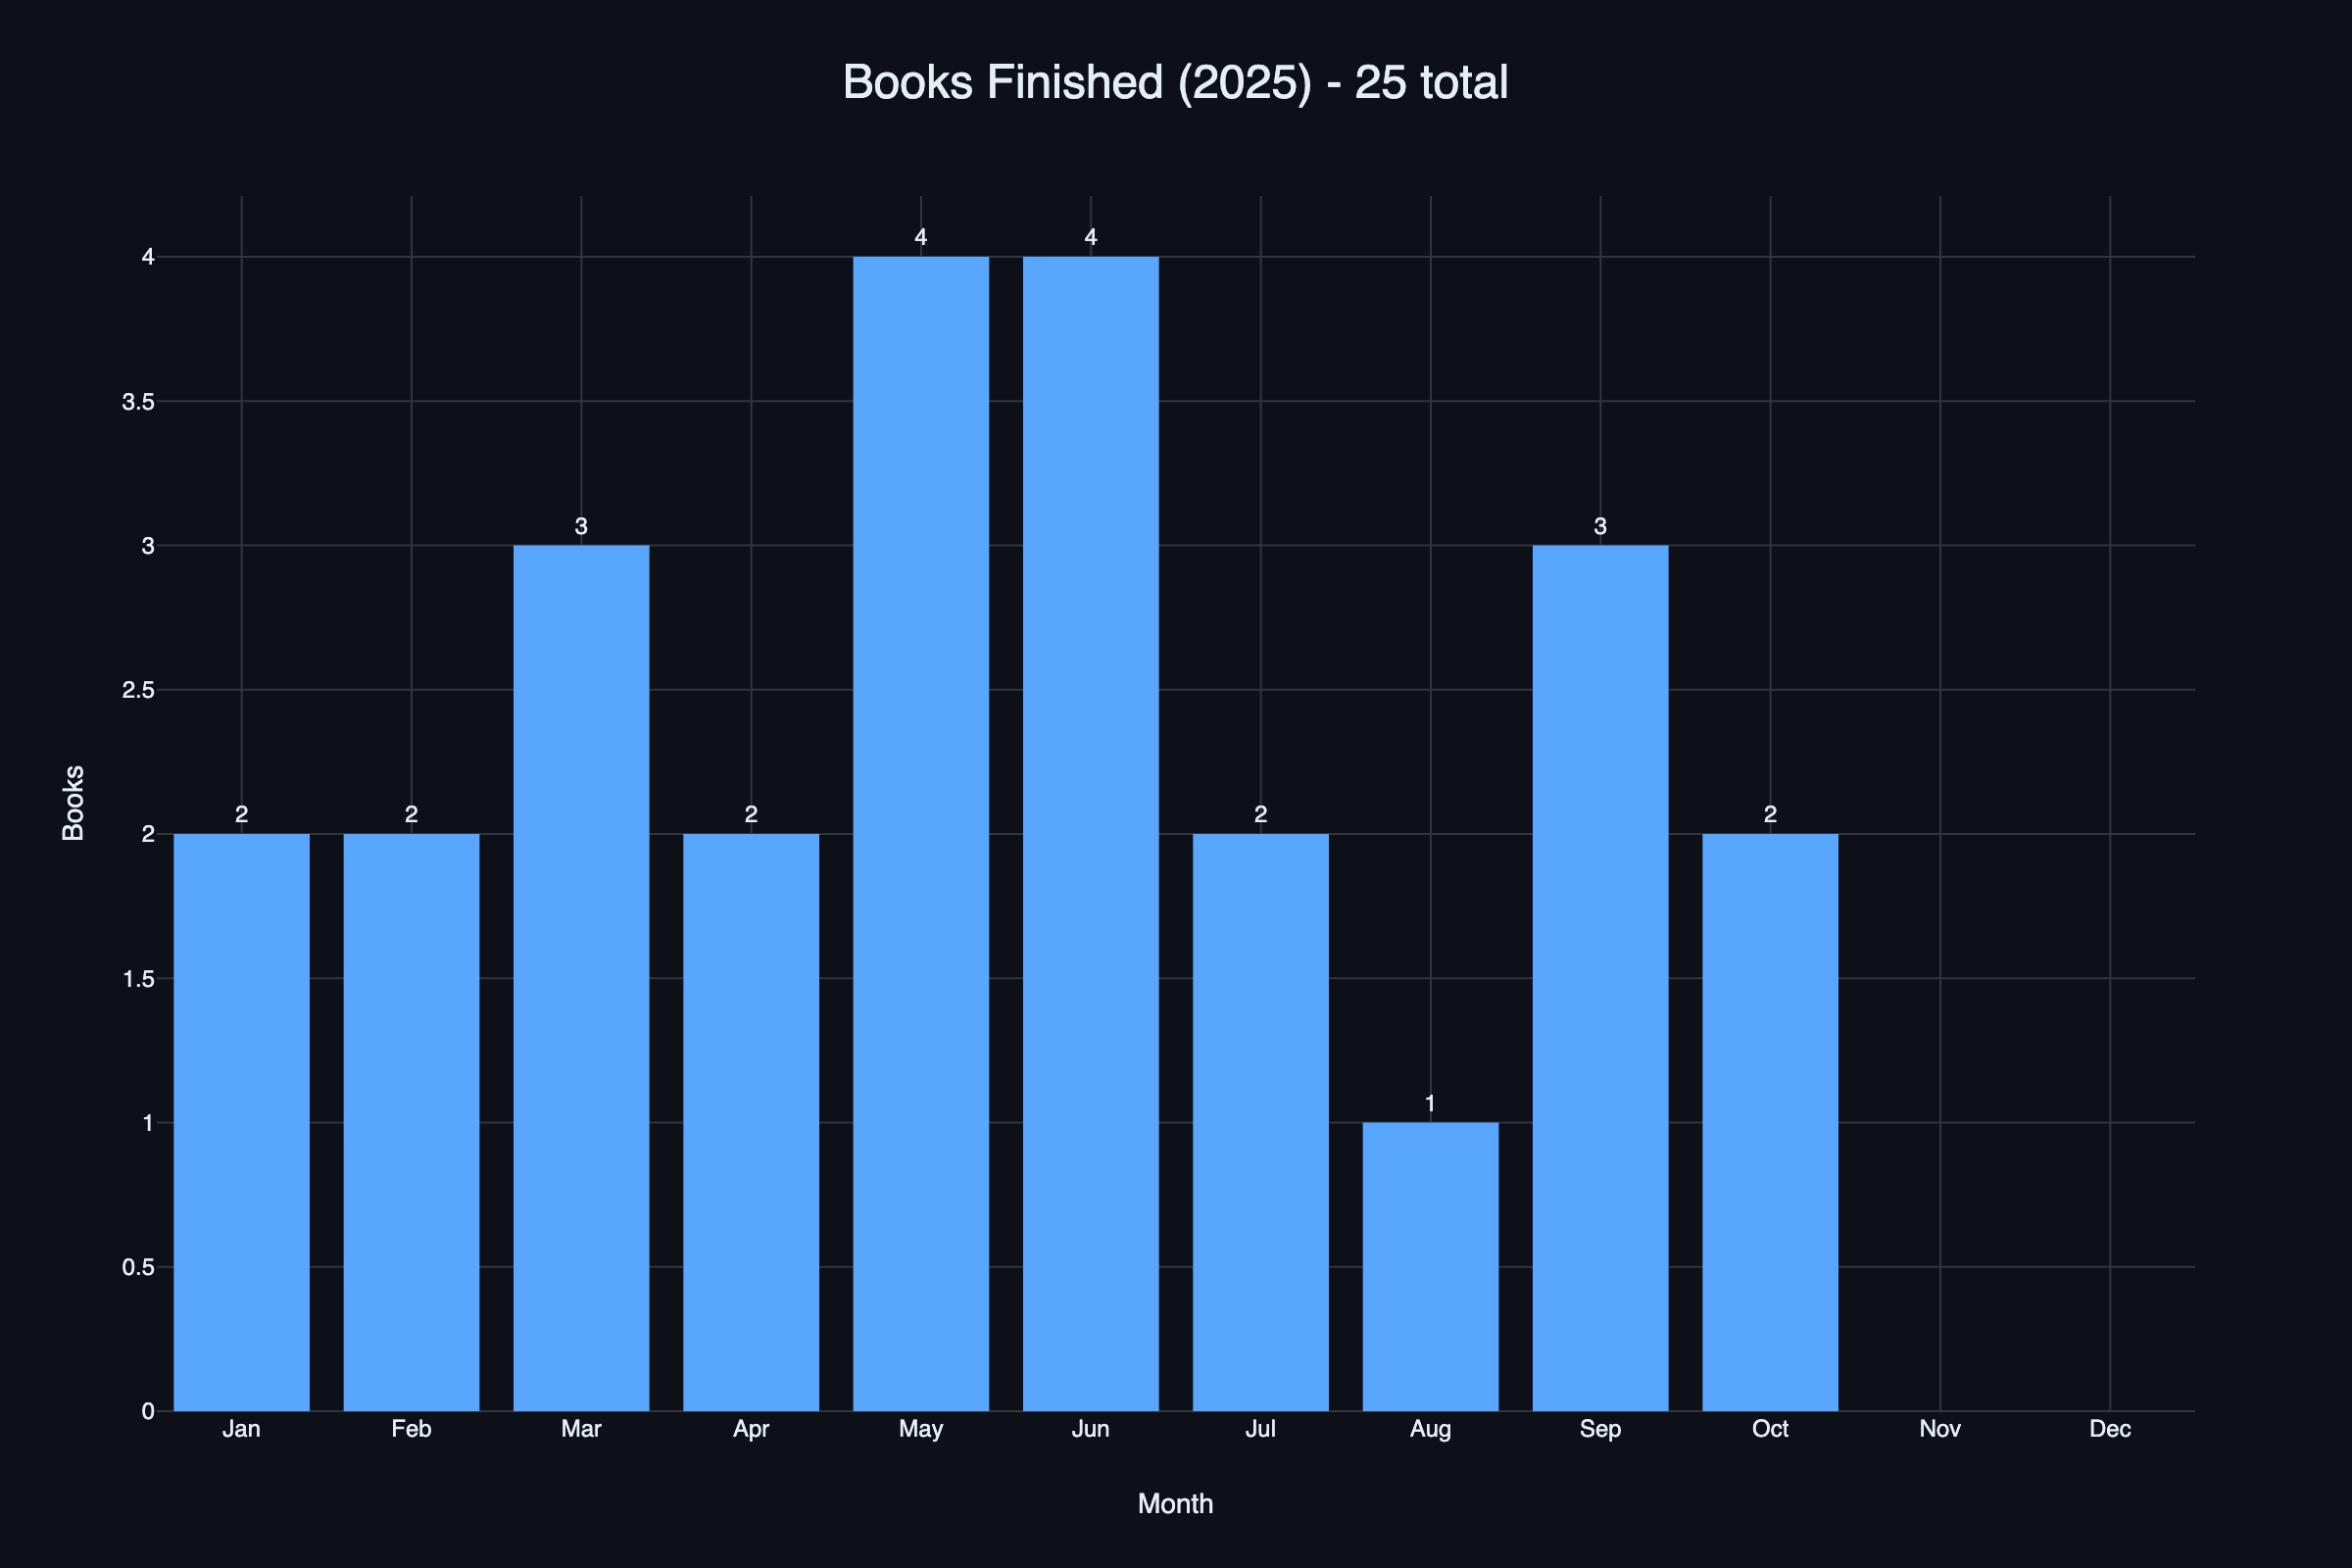
I decided not to read any books at all in November and December since I had already hit that target in October.
Top 5 books of this year for me were:
- A Thousand Splendid Suns
- I mean it’s Khaled Hosseini not much else to say.
- Freezing Order
- This was an interesting PoV seeing Russia’s action on foreign soil.
- And Then All Hell Broke Loose
- This biography was amazing, not just because of the type of work Engel has done, but also because of the way he has explained the origins of several of these militia/terrorist groups and why they are the way they are.
- Game of Spies
- WWII Spies novels are my first love, and this one was closer to being what it’s really like being a spy, no-nonsense stuff.
- The Boyfriend
Since I have been reading articles on Instapaper, I couldn’t really figure out a good method to know how much I read in 2025, but I was able to generate a few other graphs.
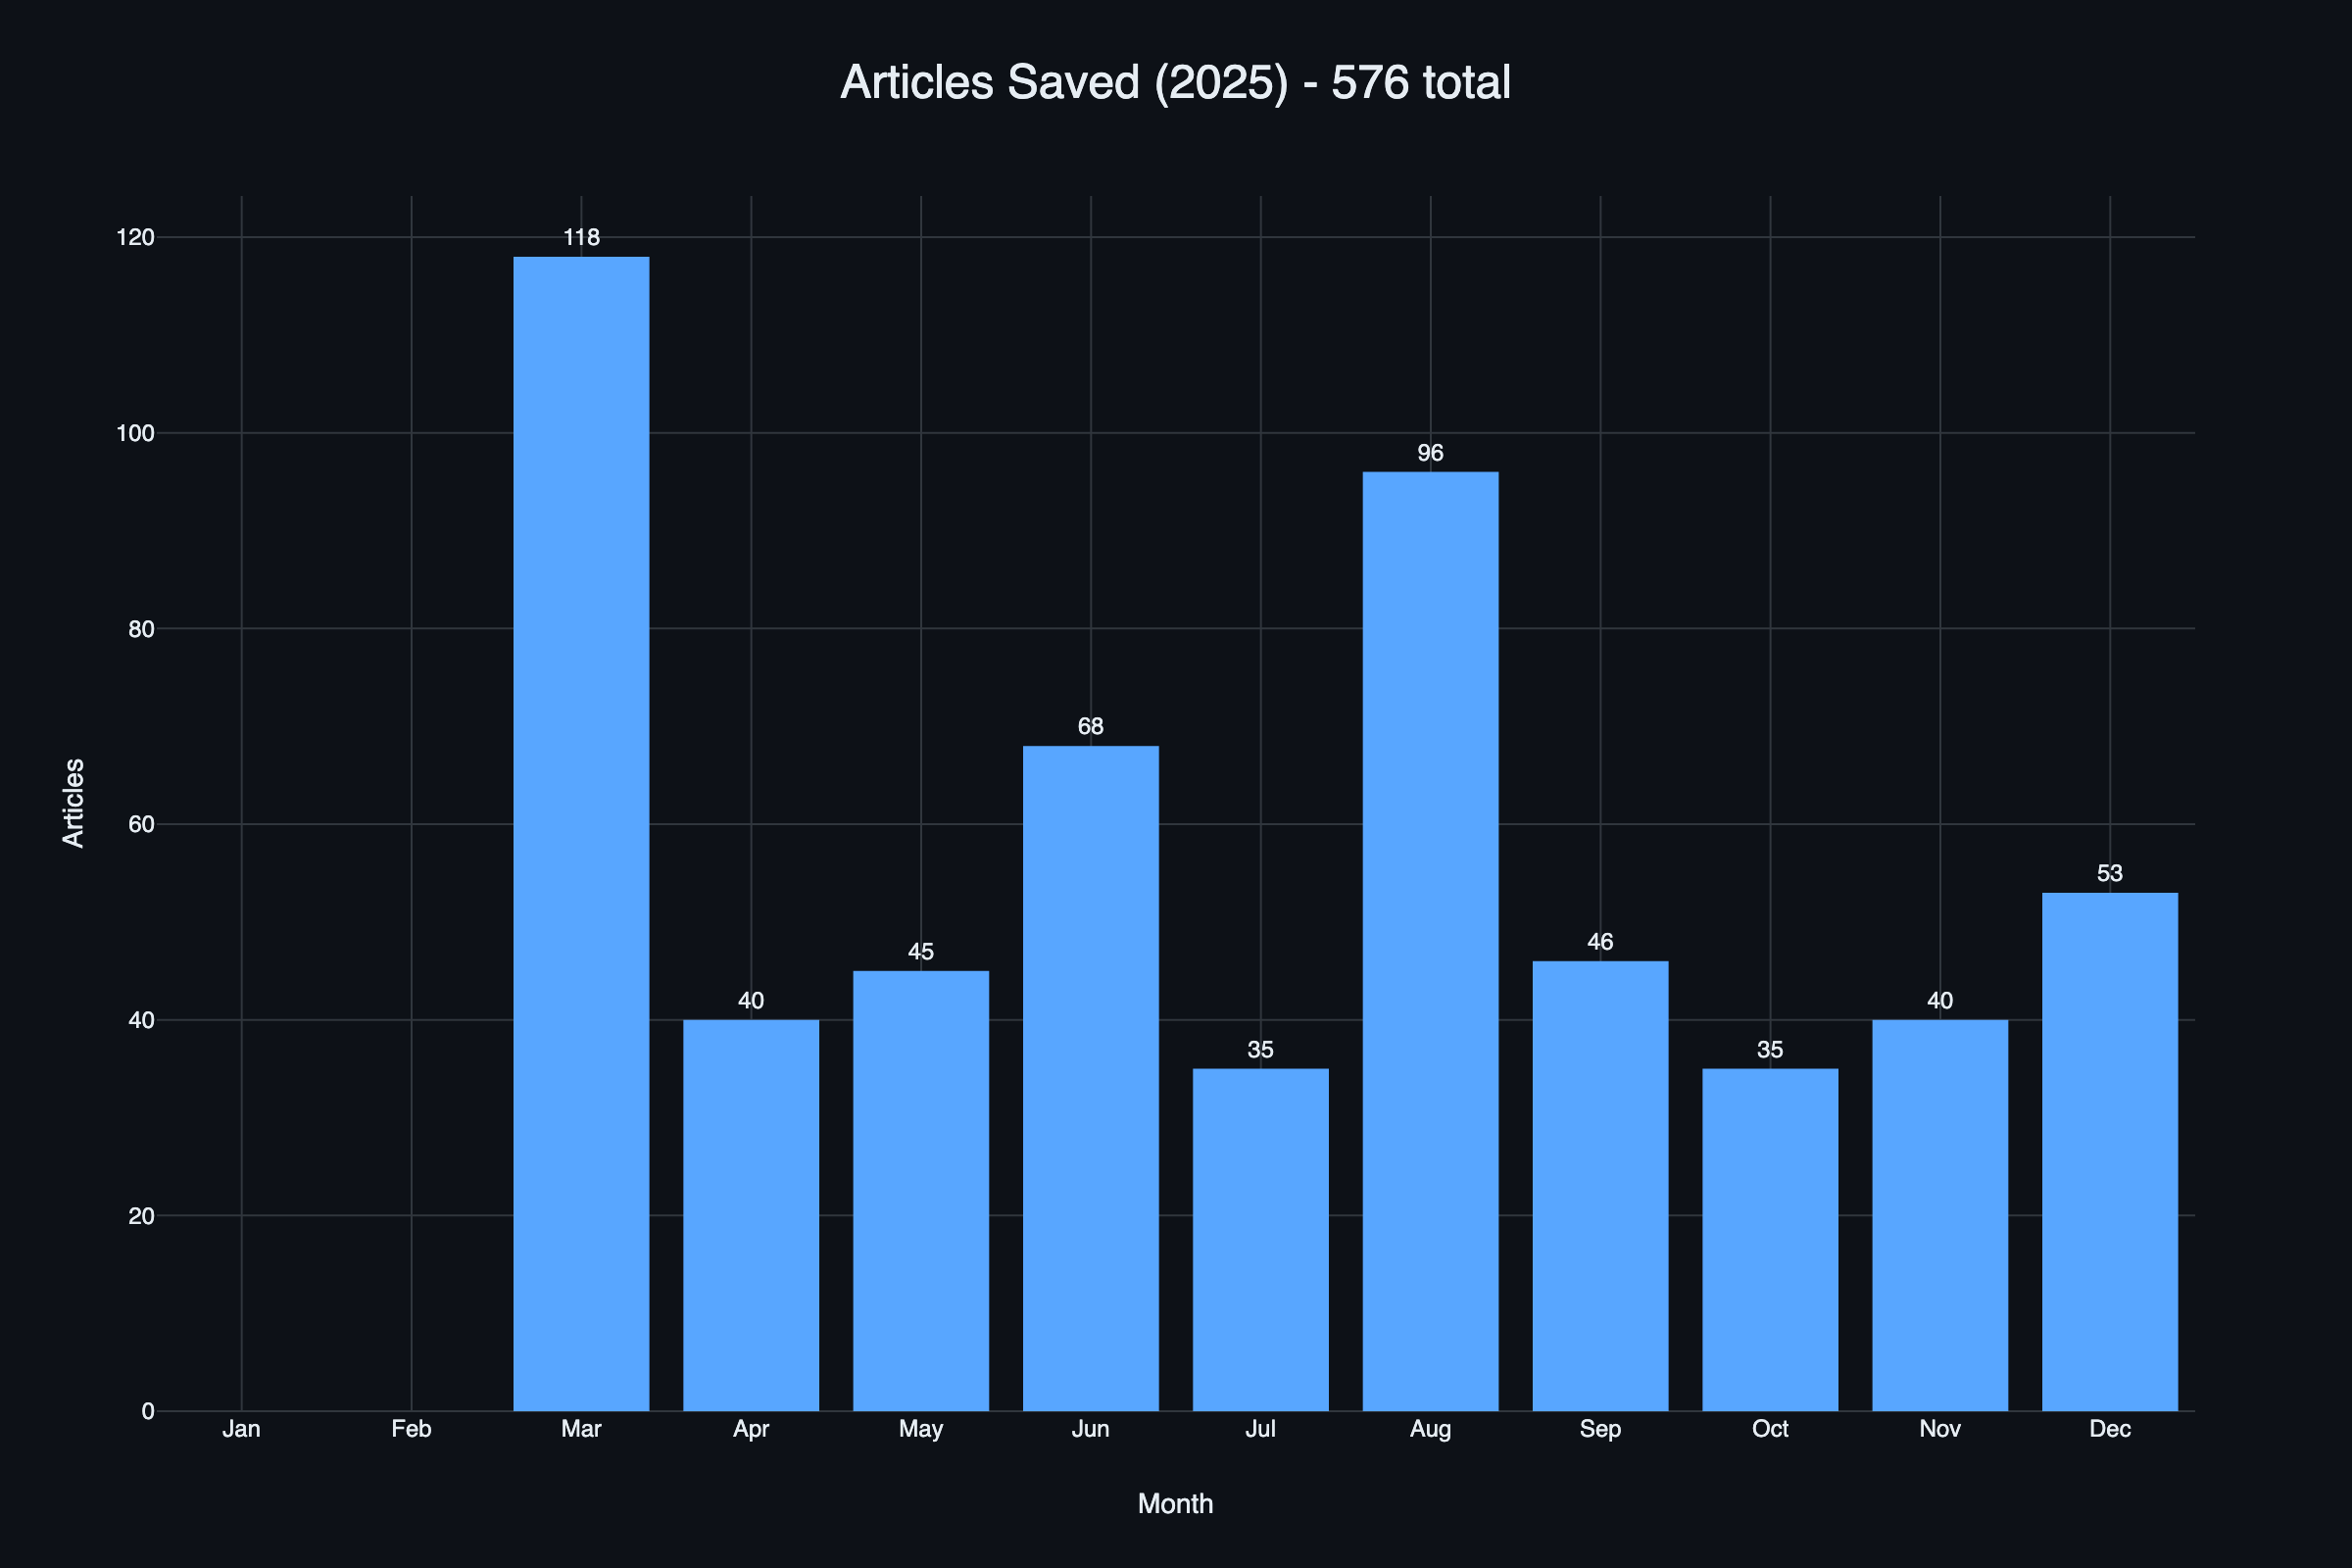
The issue with knowing how many articles I saved is that I am not really sure why there are those spikes. Was I going to new and deep ends of the internet and wanted to read more stuff, or were months like March, June, August the months when people on the internet put out really good stuff? No idea.
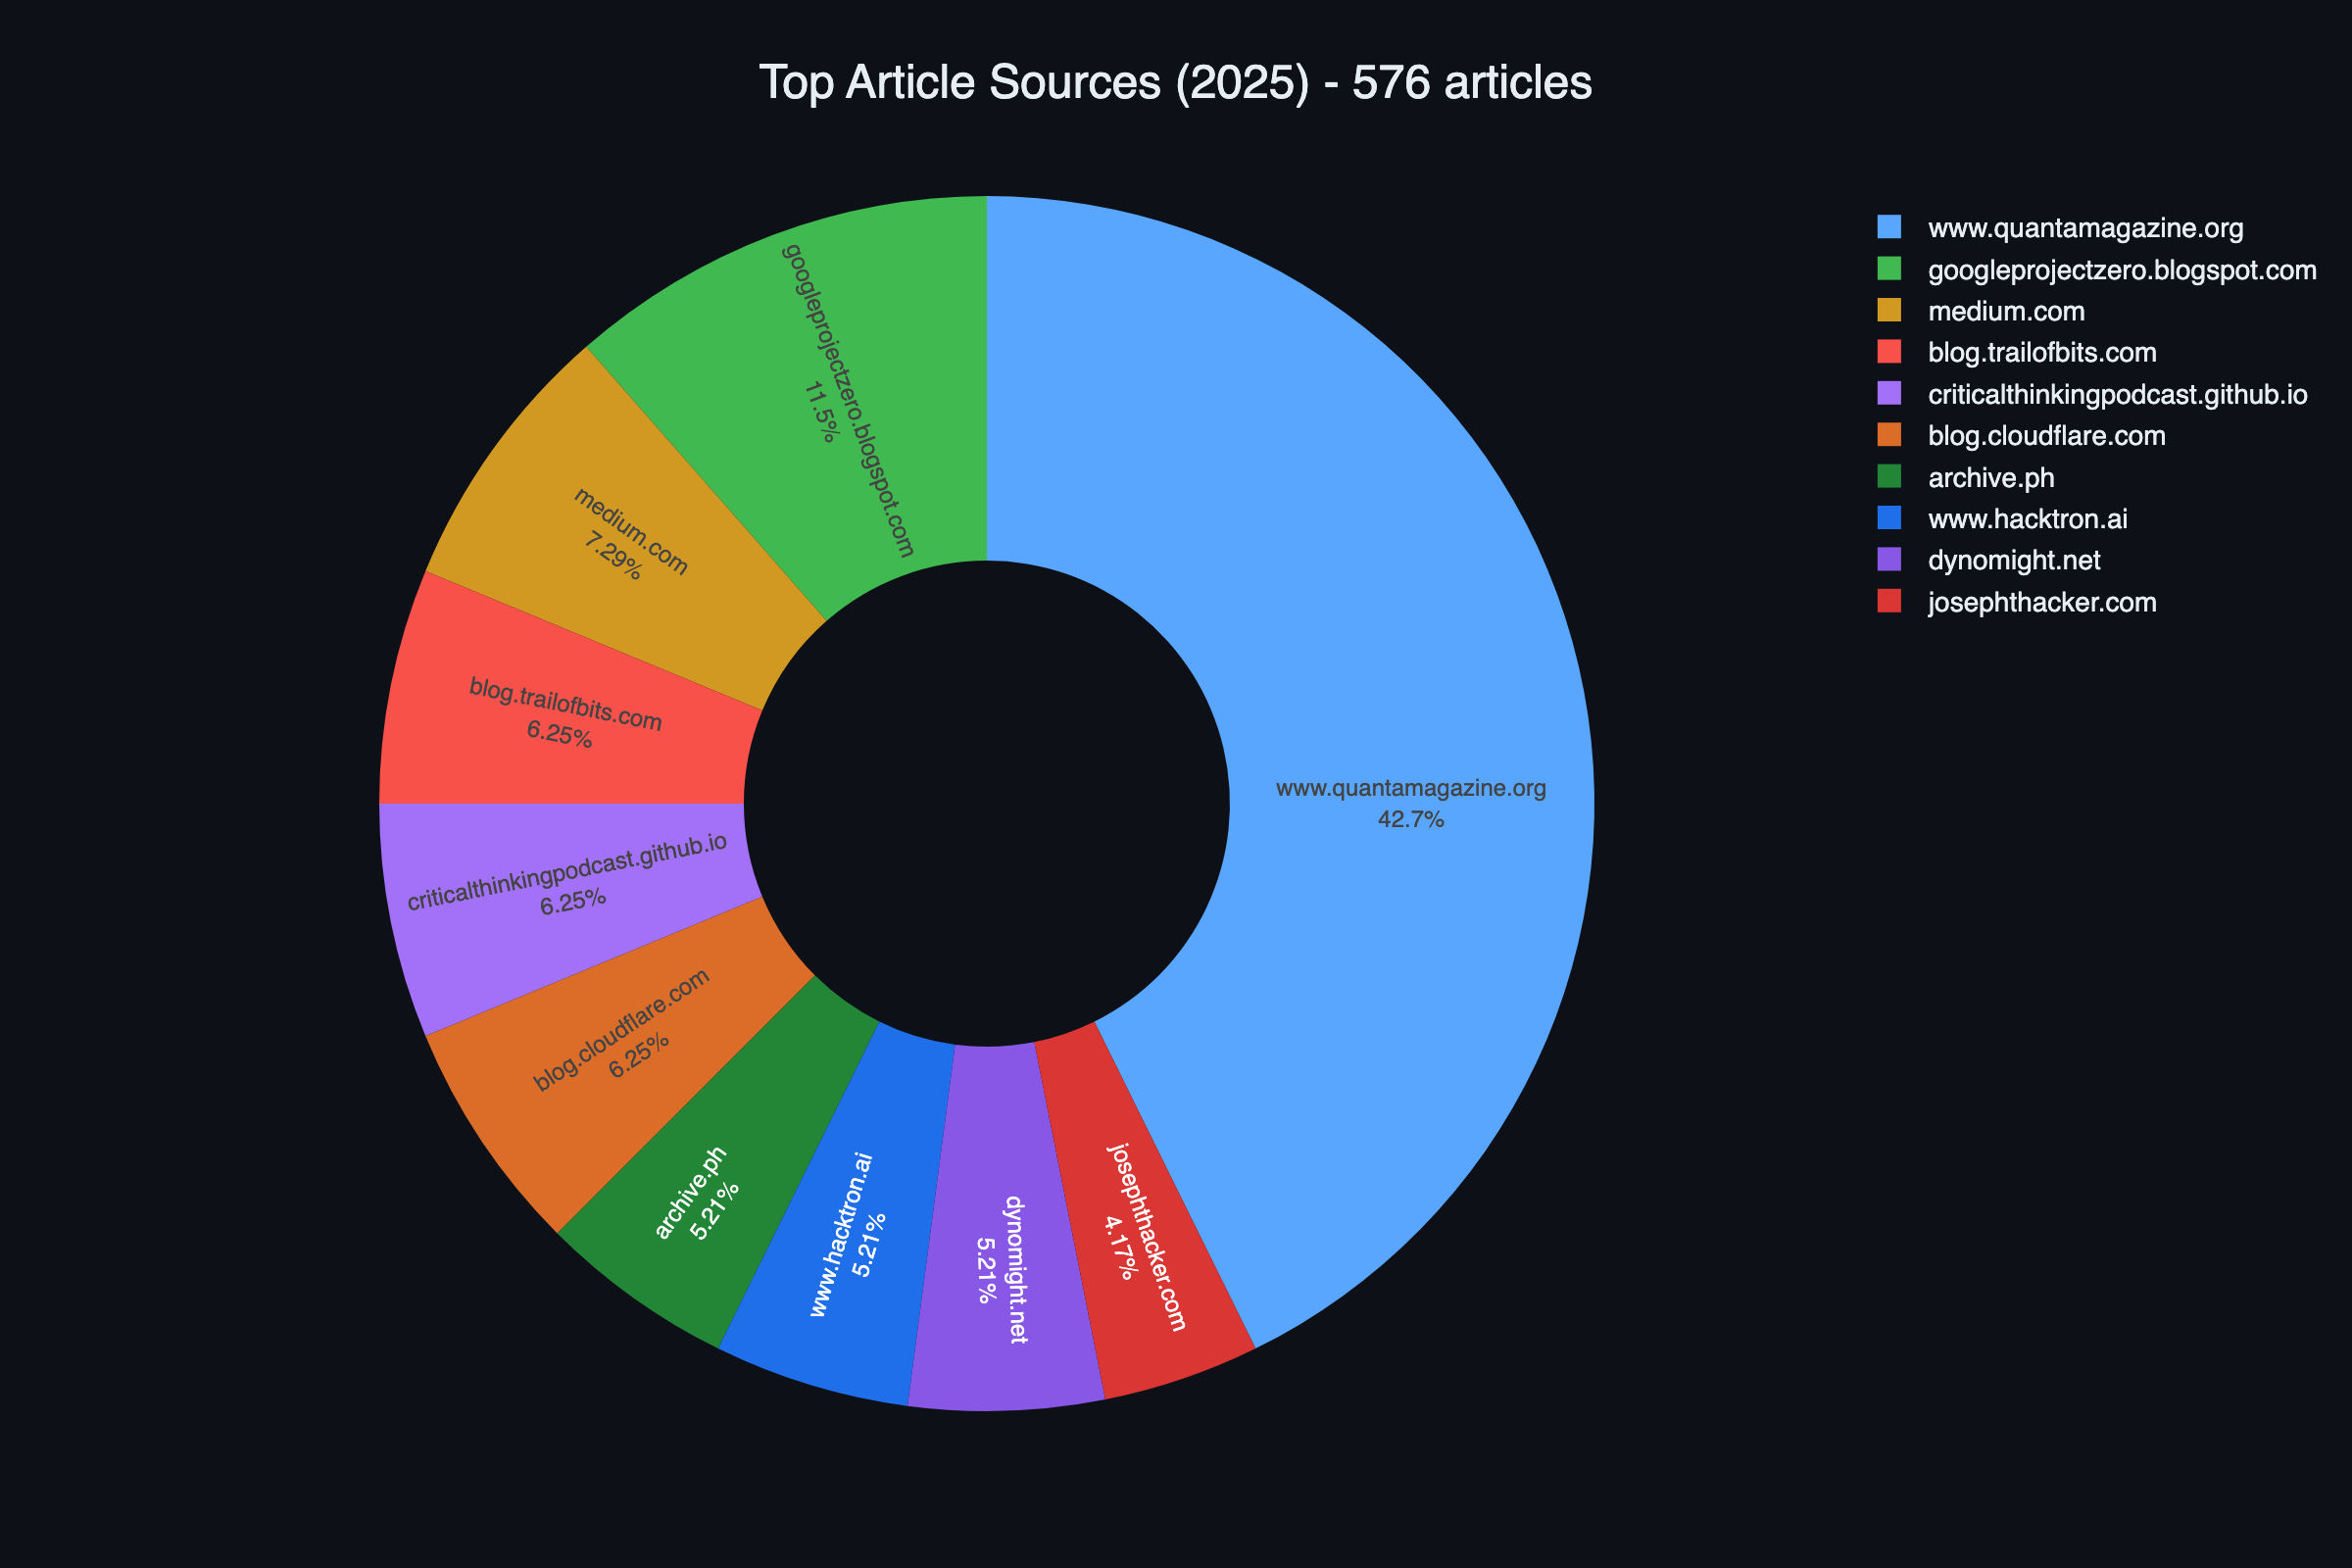 This is actually fun to know. I am not surprised to see that Quanta is on top. Reading non-tech stuff kind of makes a good late-night read. Though I’m surprised P0’s blog is above Medium, mostly because it always seems like the majority of people just use Medium Please stop doing that . But at the same time, P0 blog posts are fun to read; going through Jann Horn’s article is like seeing a master at work.
Work, Tech & Productivity
I don’t think I did this last year, but I have it all here this year. I’m still using ActivityWatch; it’s great, it has always been great. And until I figure out a simple way to get all the data from Screen Time’s db that’s what I’m going to use.
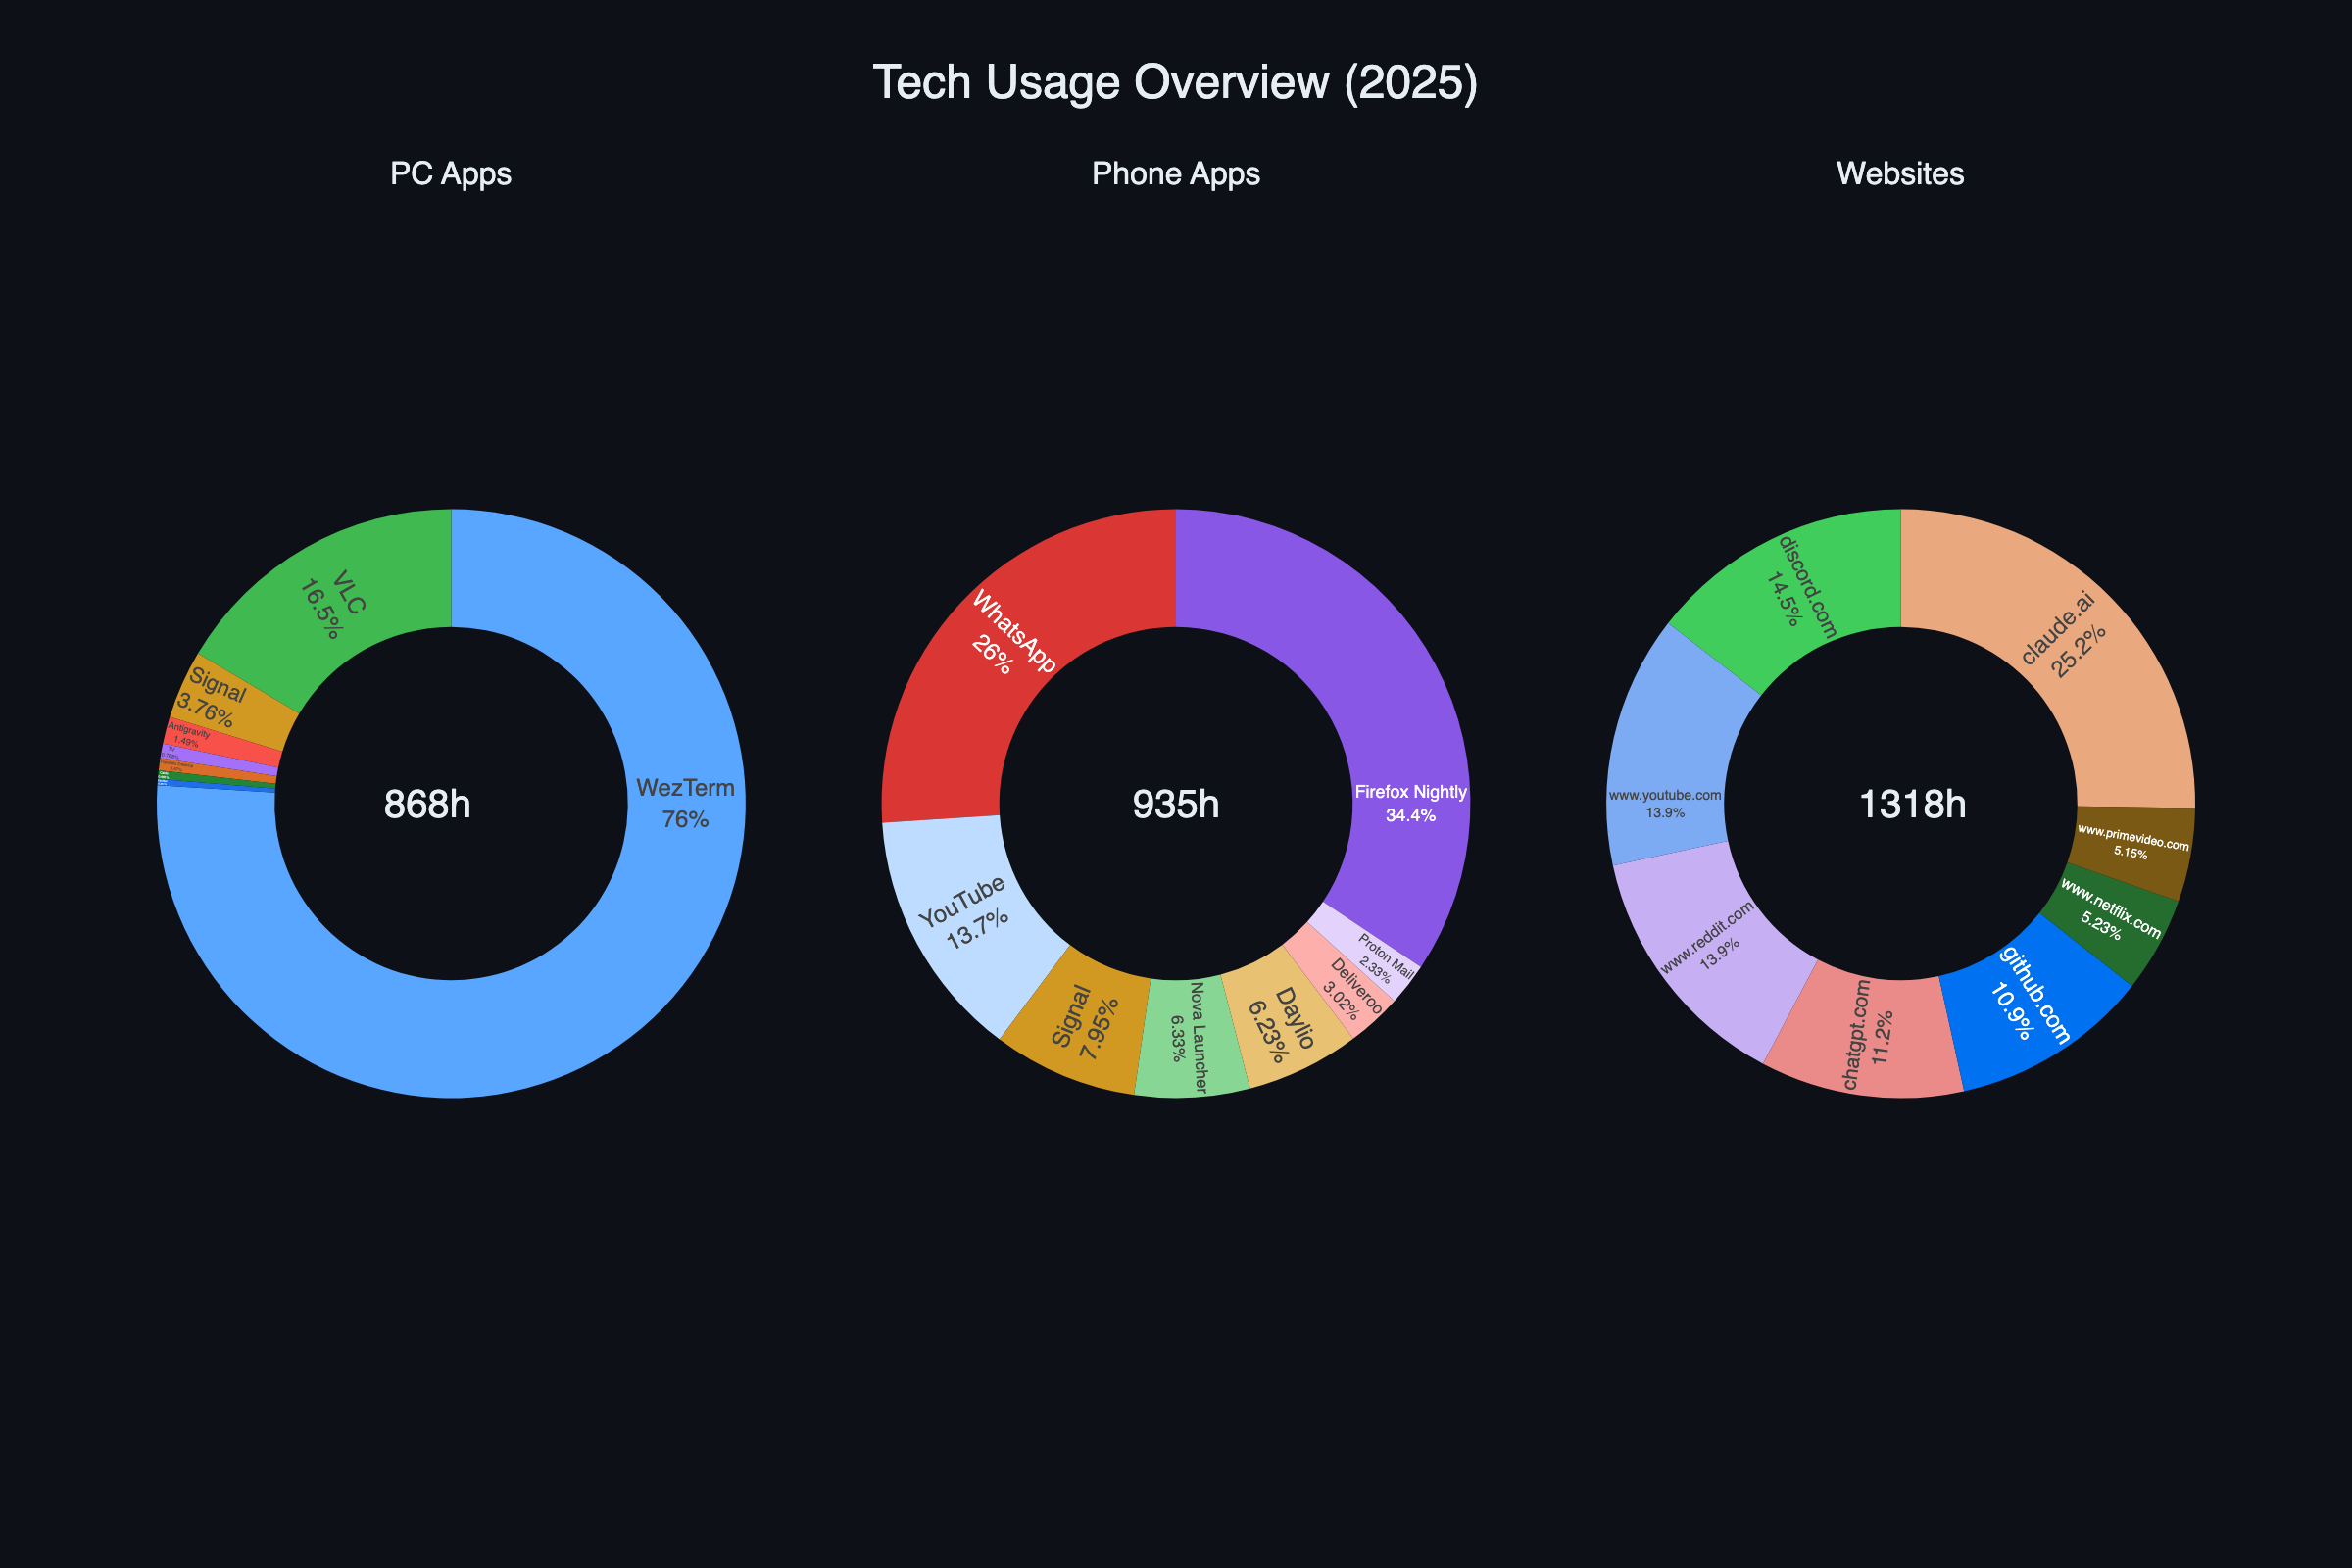
As you can see, on websites, a lot of Claude and ChatGPT. Well, Simon Willison said it best, 2025: the year of LLMs. There isn’t much to break down in these. I am not surprised to see any of the websites or apps, apart from maybe Deliveroo I don’t order a lot of stuff, but maybe the usage is high cause whenever I do order things, finding what to order takes so much time, in my top website/app.
This year, though, and I am not sure why I didn’t do this before, I added tmux watcher in my ActivityWatch, and because of that, I am able to get more charts out :tada:
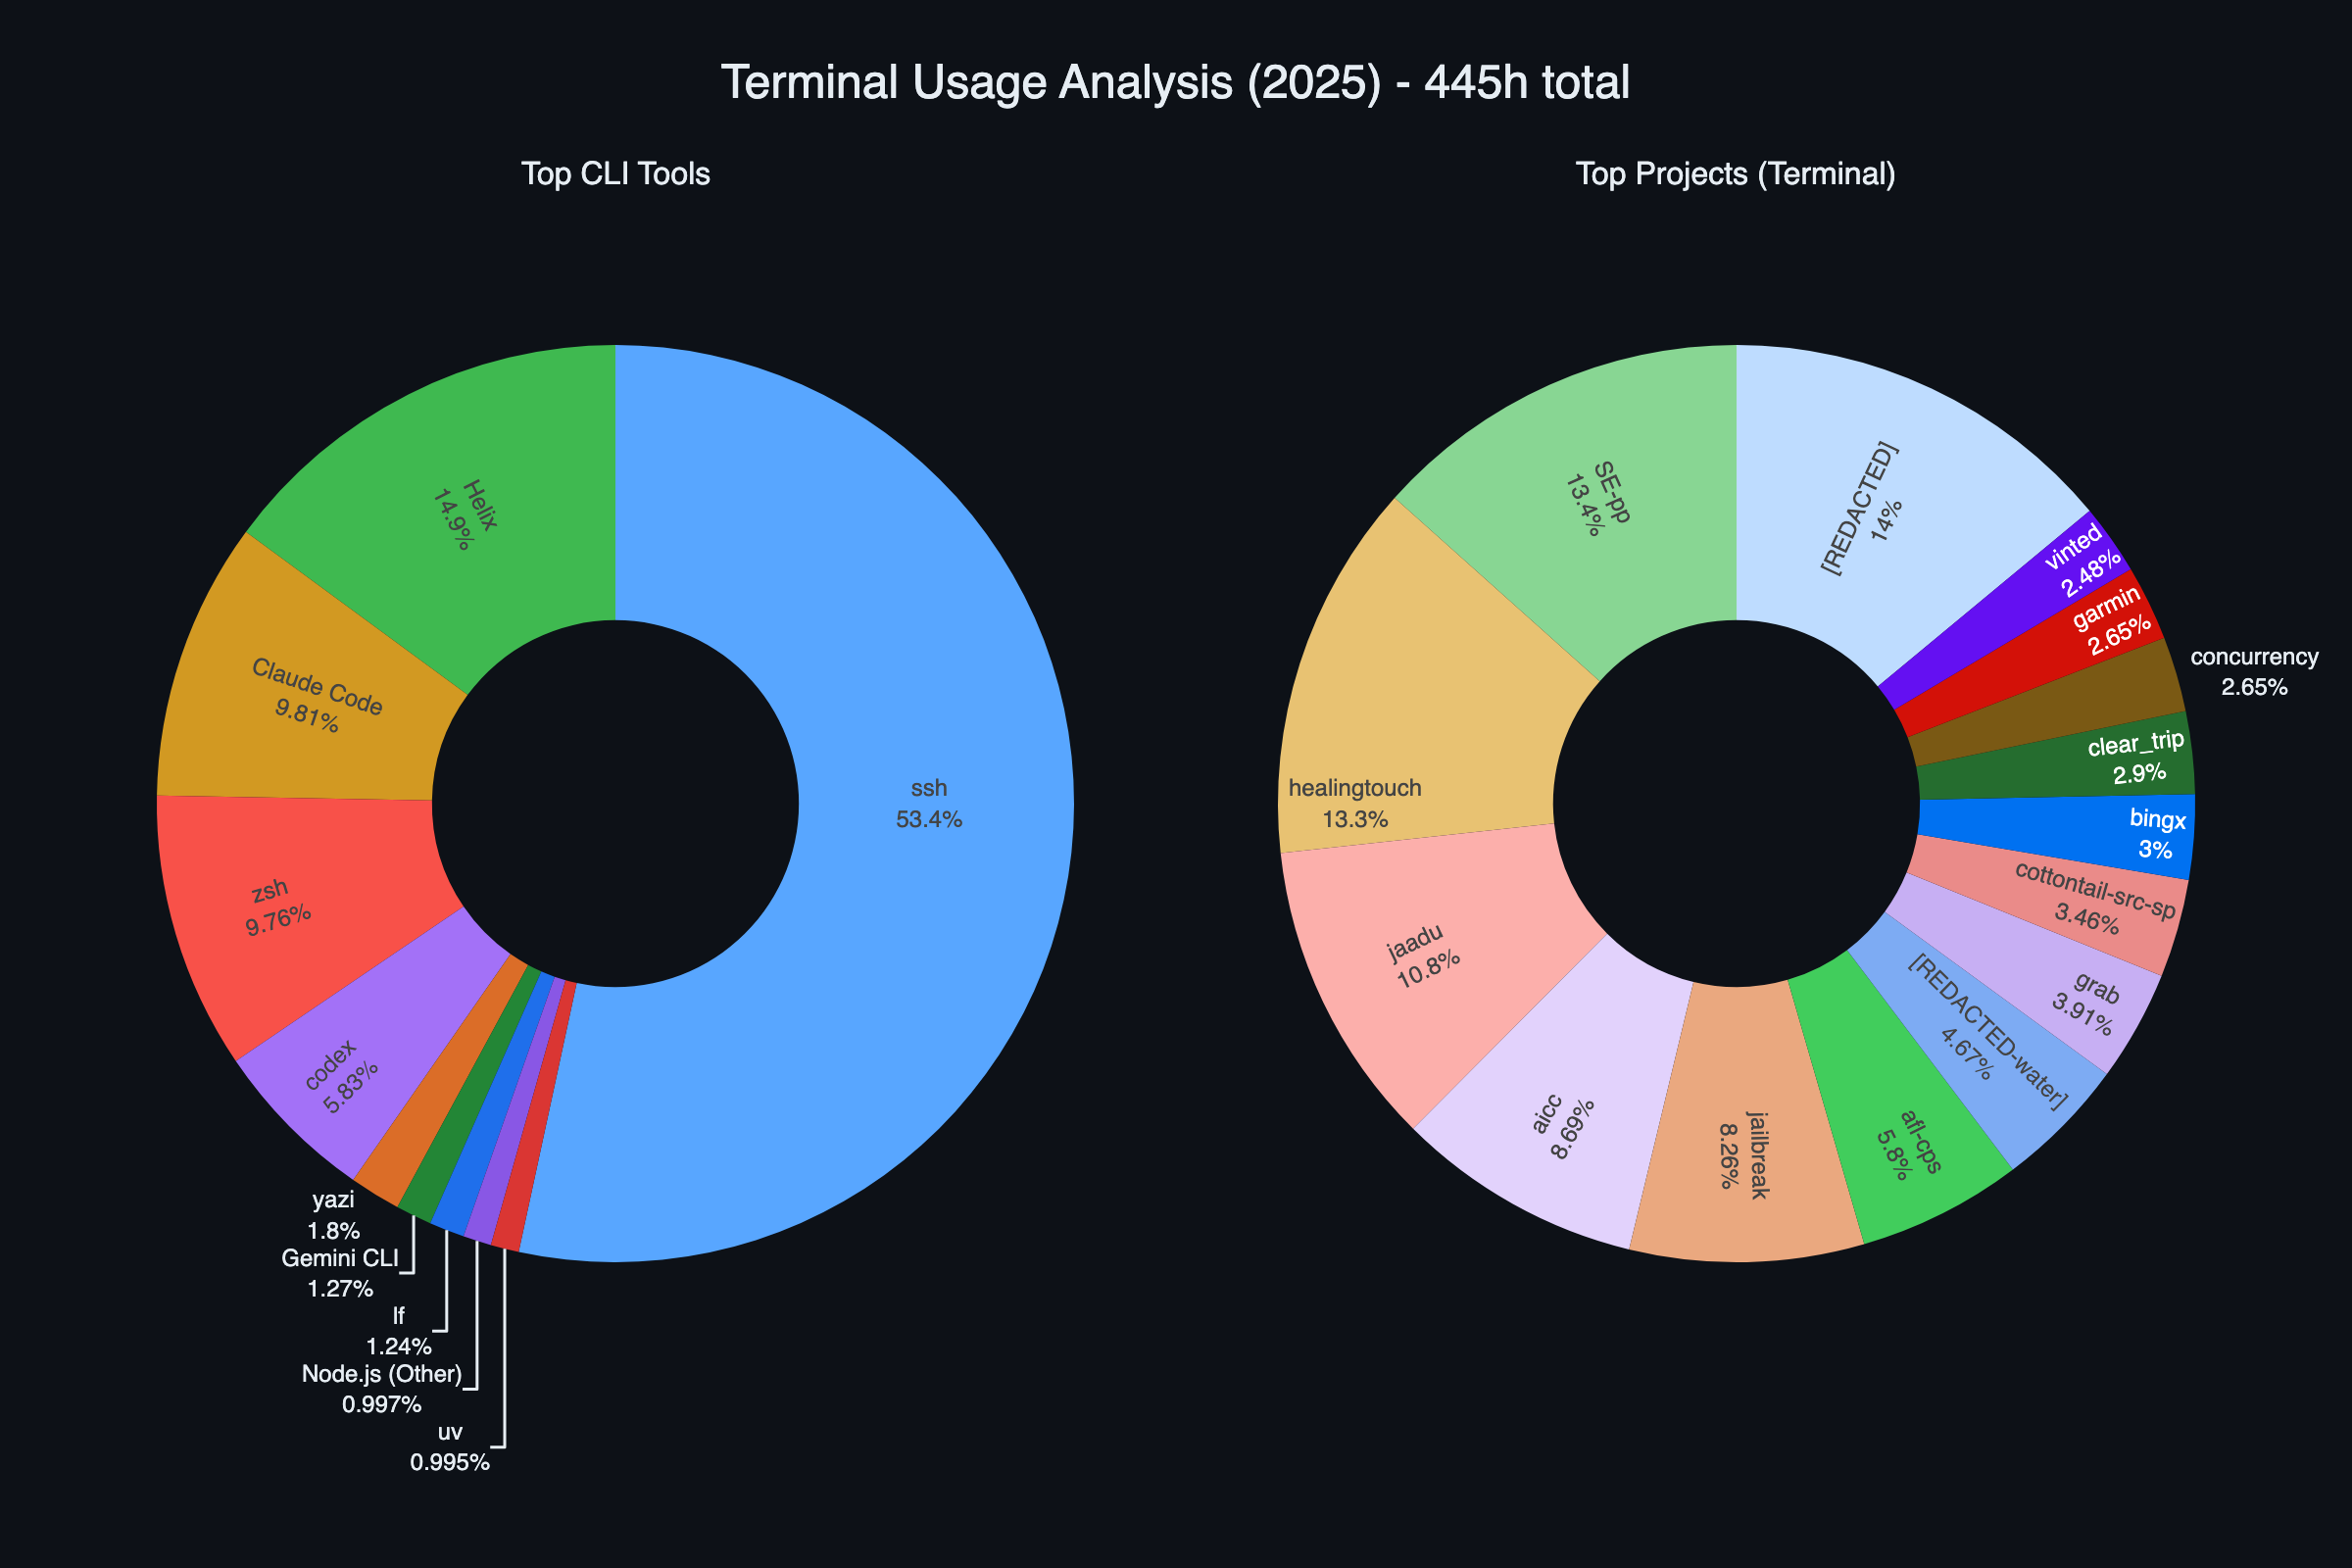
That 50% of SSH is also probably helix + one of the agents. As we can see, things aren’t perfect, and “zsh” is showing up there, mostly because automatic tab naming sometimes leaves the tab name to “zsh” (haven’t figured out why). I think CLI chart is pretty self-explanatory and not much surprising. All the Claude/Codex/Gemini have been useful at different times. One thing we can see is that I discovered yazi this year and it quickly became a top app still using it with alias lf, old habit die hard .
It’s interesting to look at the projects graph, really puts into perspective all the things I did and didn’t do, and how much time they actually took. For example, The “jailbreak” is me doing Offensive testing on LLMs, and I’m surprised that it’s that big. From what I recall, I didn’t spend more than 10 hrs on it, but I guess numbers don’t lie. It’s funny to see “jaadu” is here as well, earlier this year, we thought we had “a new idea and no one is doing it” and were trying to make an agent using CAI, which would do bug bounties, mostly for web, specifically XSS. And boy was it hard. Then one day, we decided to just give Codex the playwright MCP access, and it went through Google’s XSS challenge like a hot knife through butter. That very moment, I decided to delete the repo (local only :).
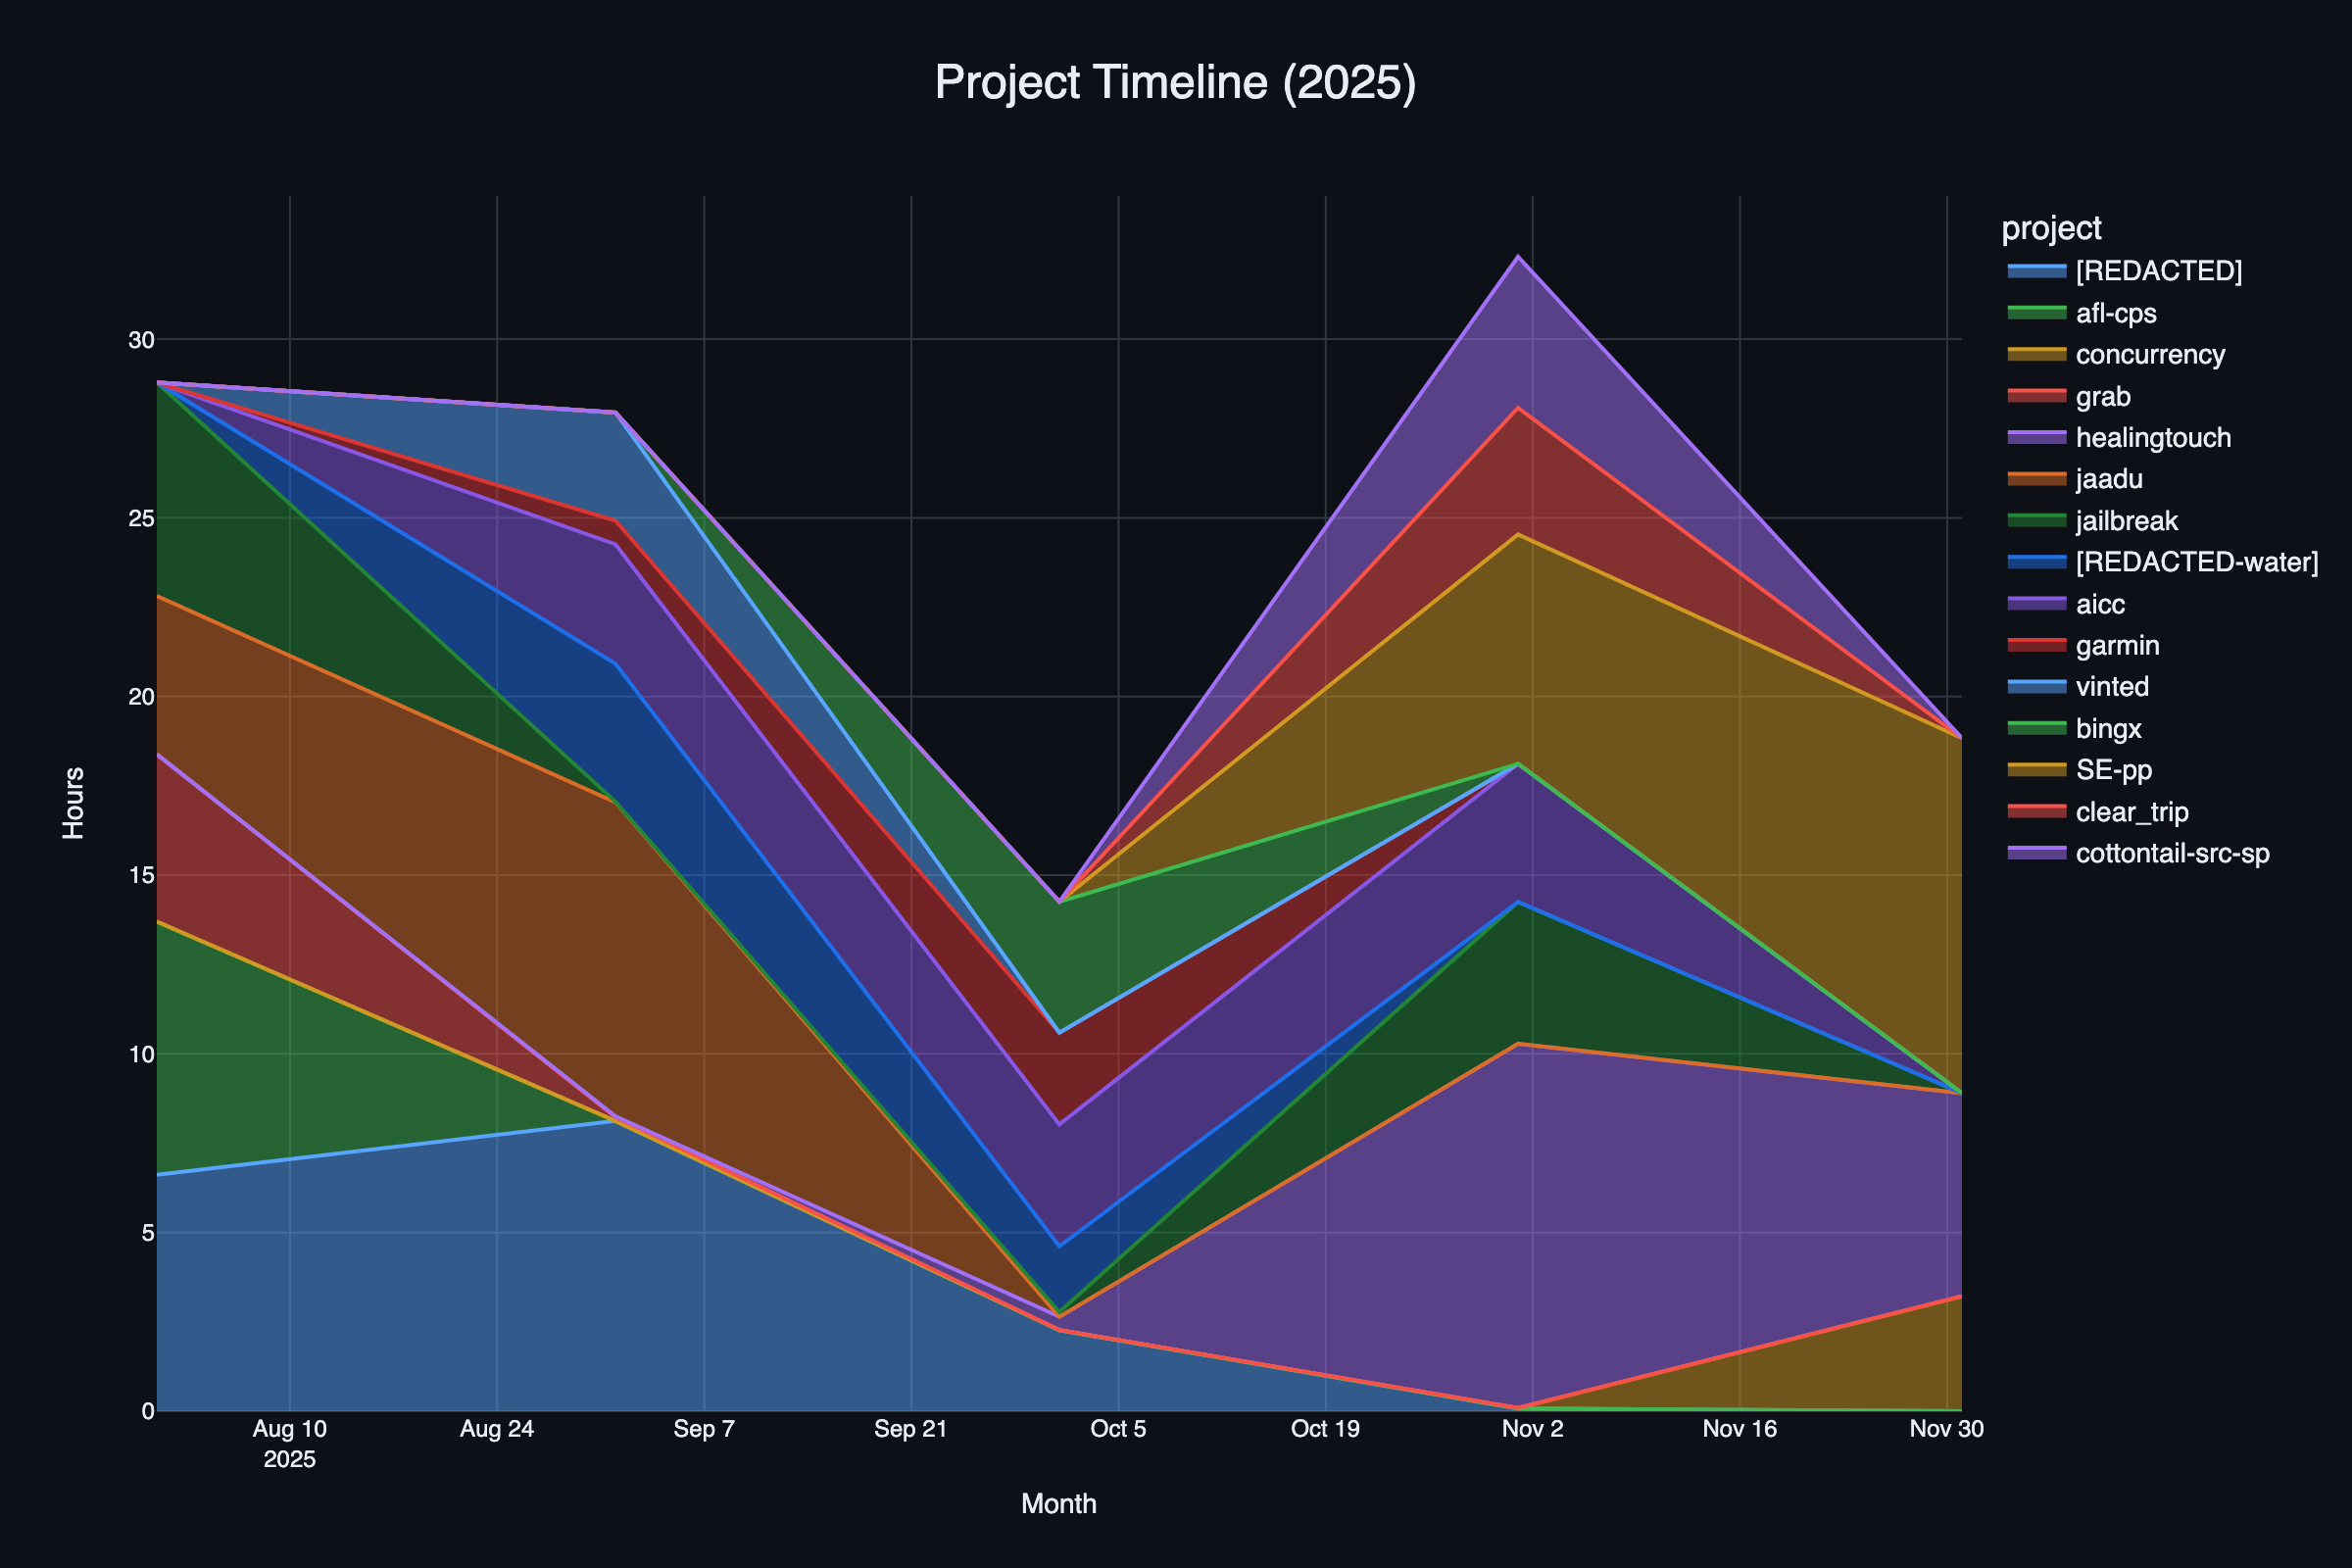
This is just another view of projects, it’s nothing new, I just liked the graph so here it is.
Overall, two things are clear from this.
- YouTube watch time went really down it’s around ~311 hrs in the whole year, which is roughly 150 hours less than what I watched in 2024. It’s not a great number in itself, but decreasing, so WIP.
- Agents have been a lifesaver. There have been so many arguments, skepticism, and whatnot regarding LLMs and agents, but I personally found them very useful.
- They are not a magic wand that can get things done, but they are like tools that have been highly effective, especially if you know exactly what to do.
- If you start throwing a hammer around, obviously, you’ll break stuff, but if you know exactly where to strike, then you get an unbent nail in a wall to hang a picture.
- My biggest learning from using LLMs and agents is that you can’t ask them what to do; the best way is to tell them exactly what you want.
- They are not a magic wand that can get things done, but they are like tools that have been highly effective, especially if you know exactly what to do.
More correlation graphs
Since I had agents with me this year, it was easy for me to just come up with graphs, and I really liked these correlation ones; these help connect the dots for me.
First off, a correlation between weekdays and music, coding, and TV consumption.
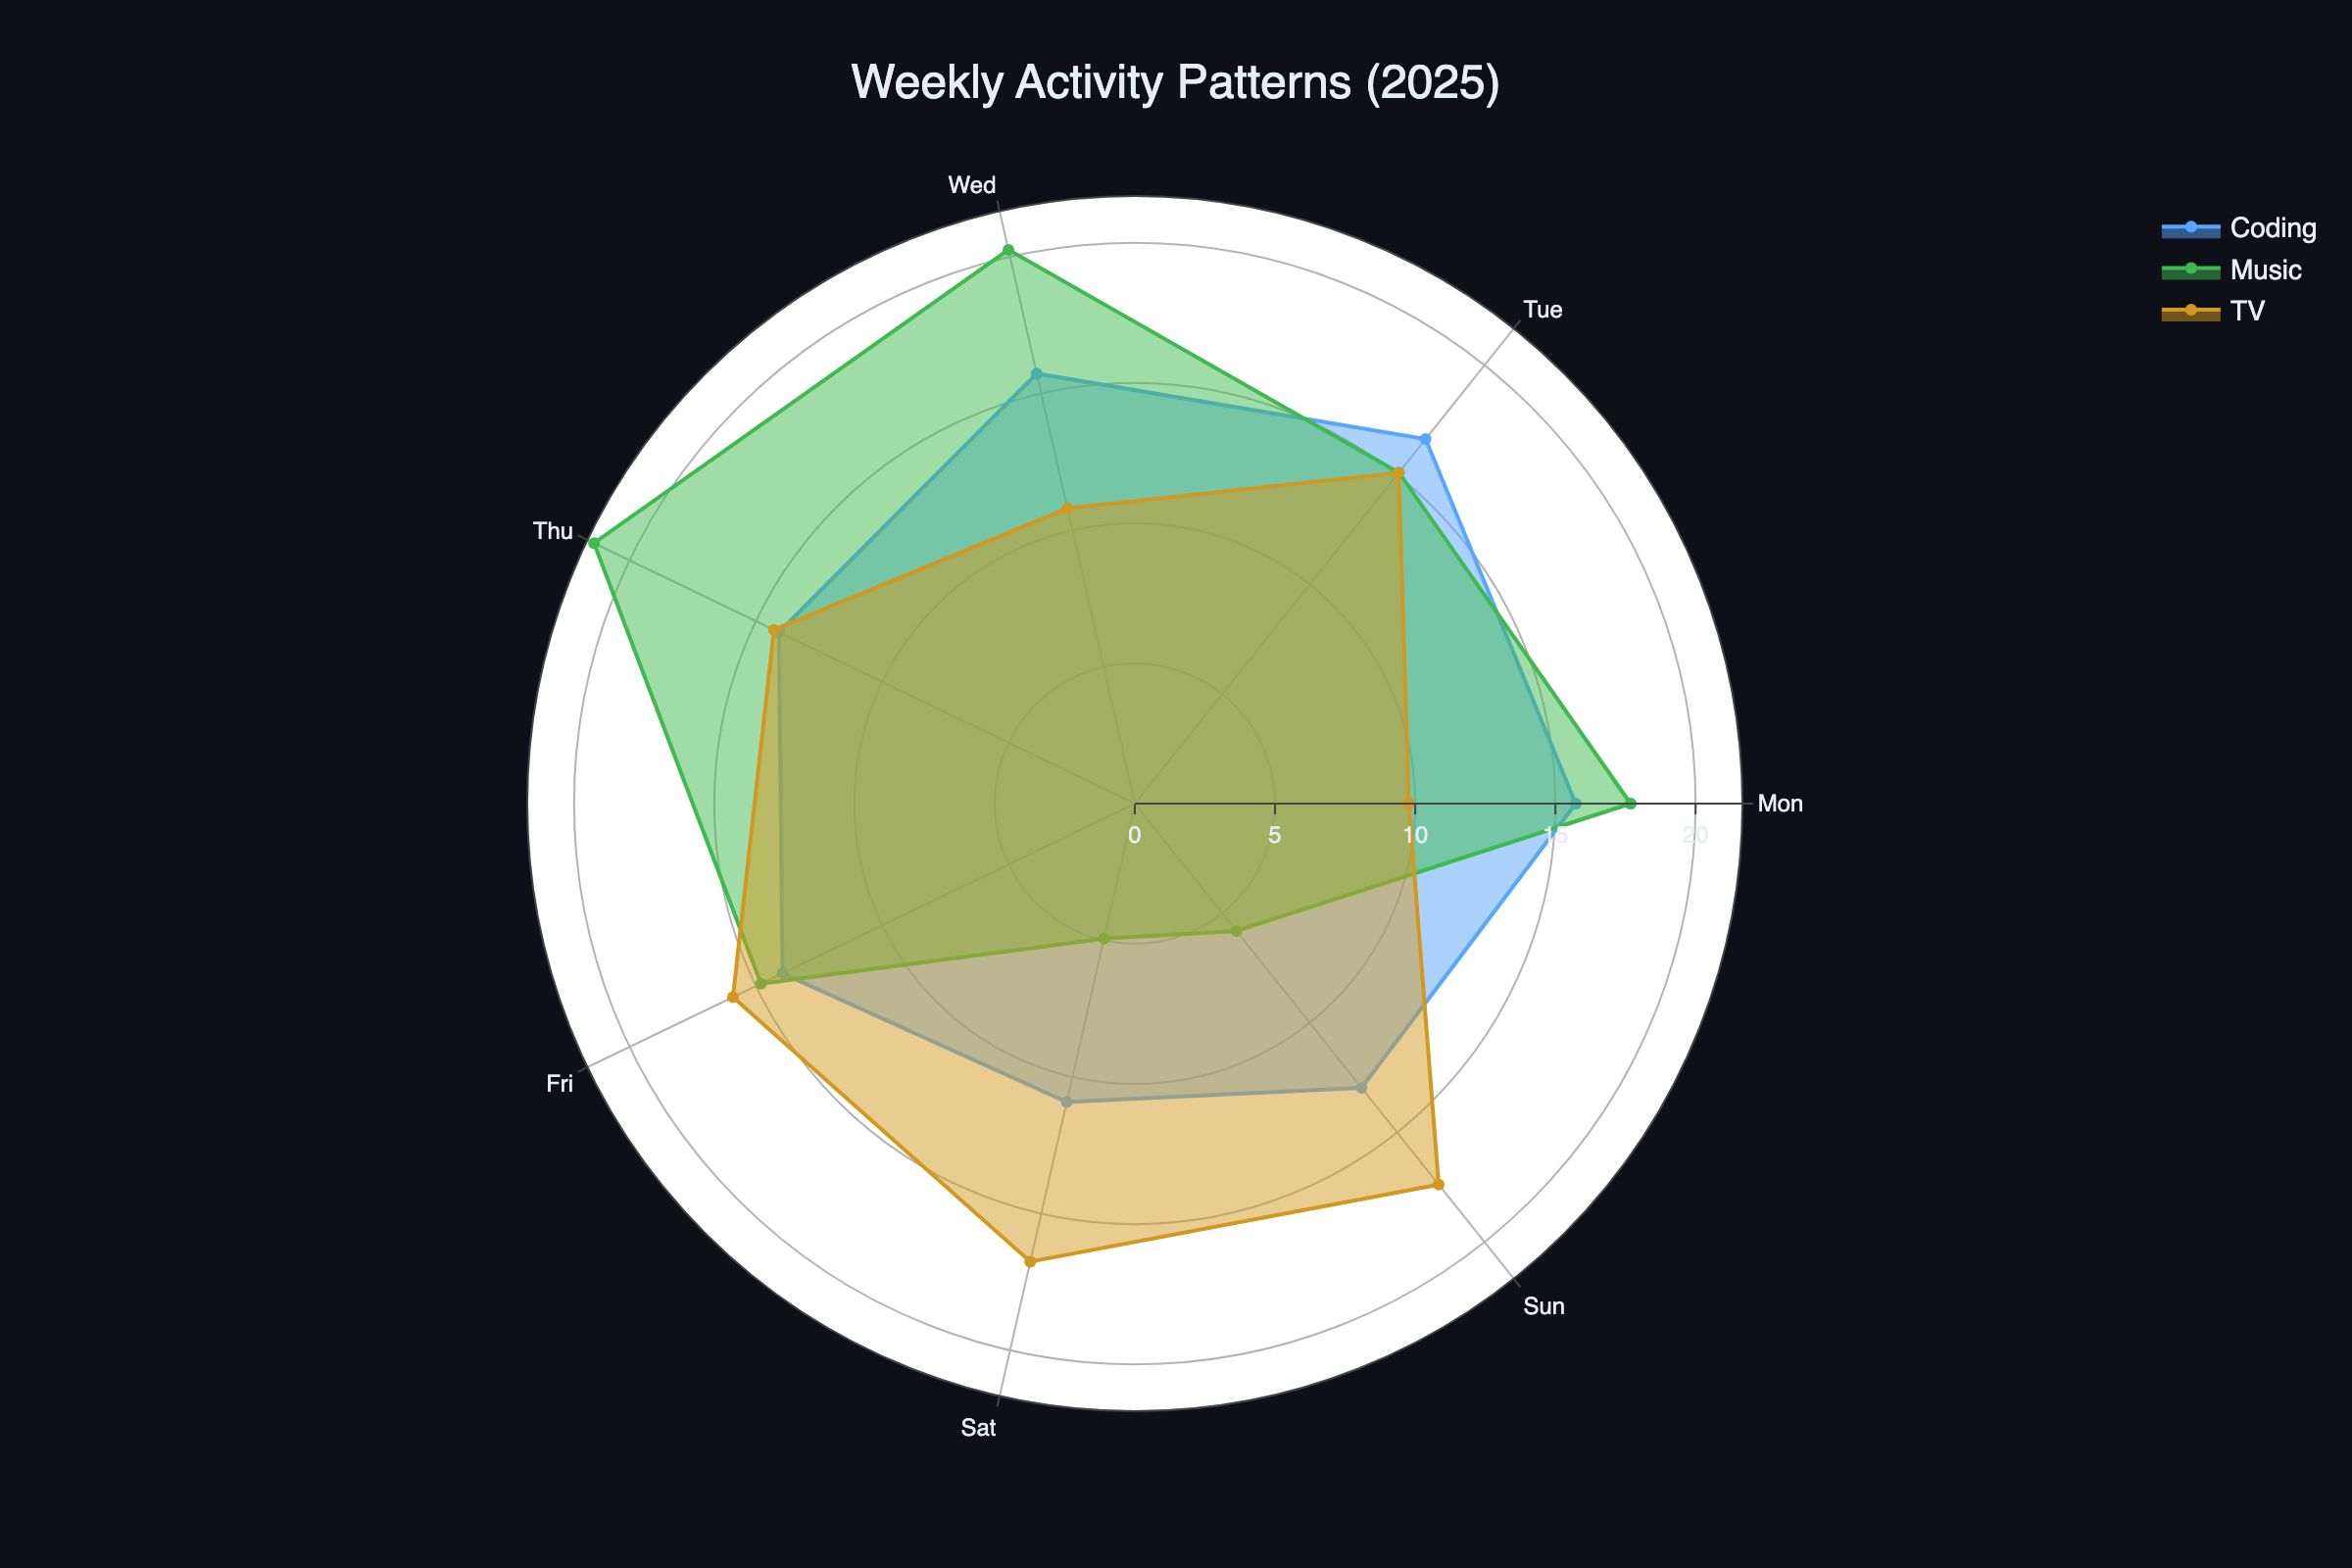
I mean it’s no surprise that on weekends I’m not listening to much music, that is mostly because of no commute. But weirdly, TV consumption is low on Monday but continues to be the same on every other day of the week; it’s unclear why that might be happening. Also work-wise Tuesday and Wednesday have been the most productive (or maybe just more work days). Maybe because on Monday everyone is still kind of getting back on the horse, tired, and those next two days are where things pick up before Thursday & Friday just slow things down again.
Then there is the classic “Creation vs Consumption” battle.
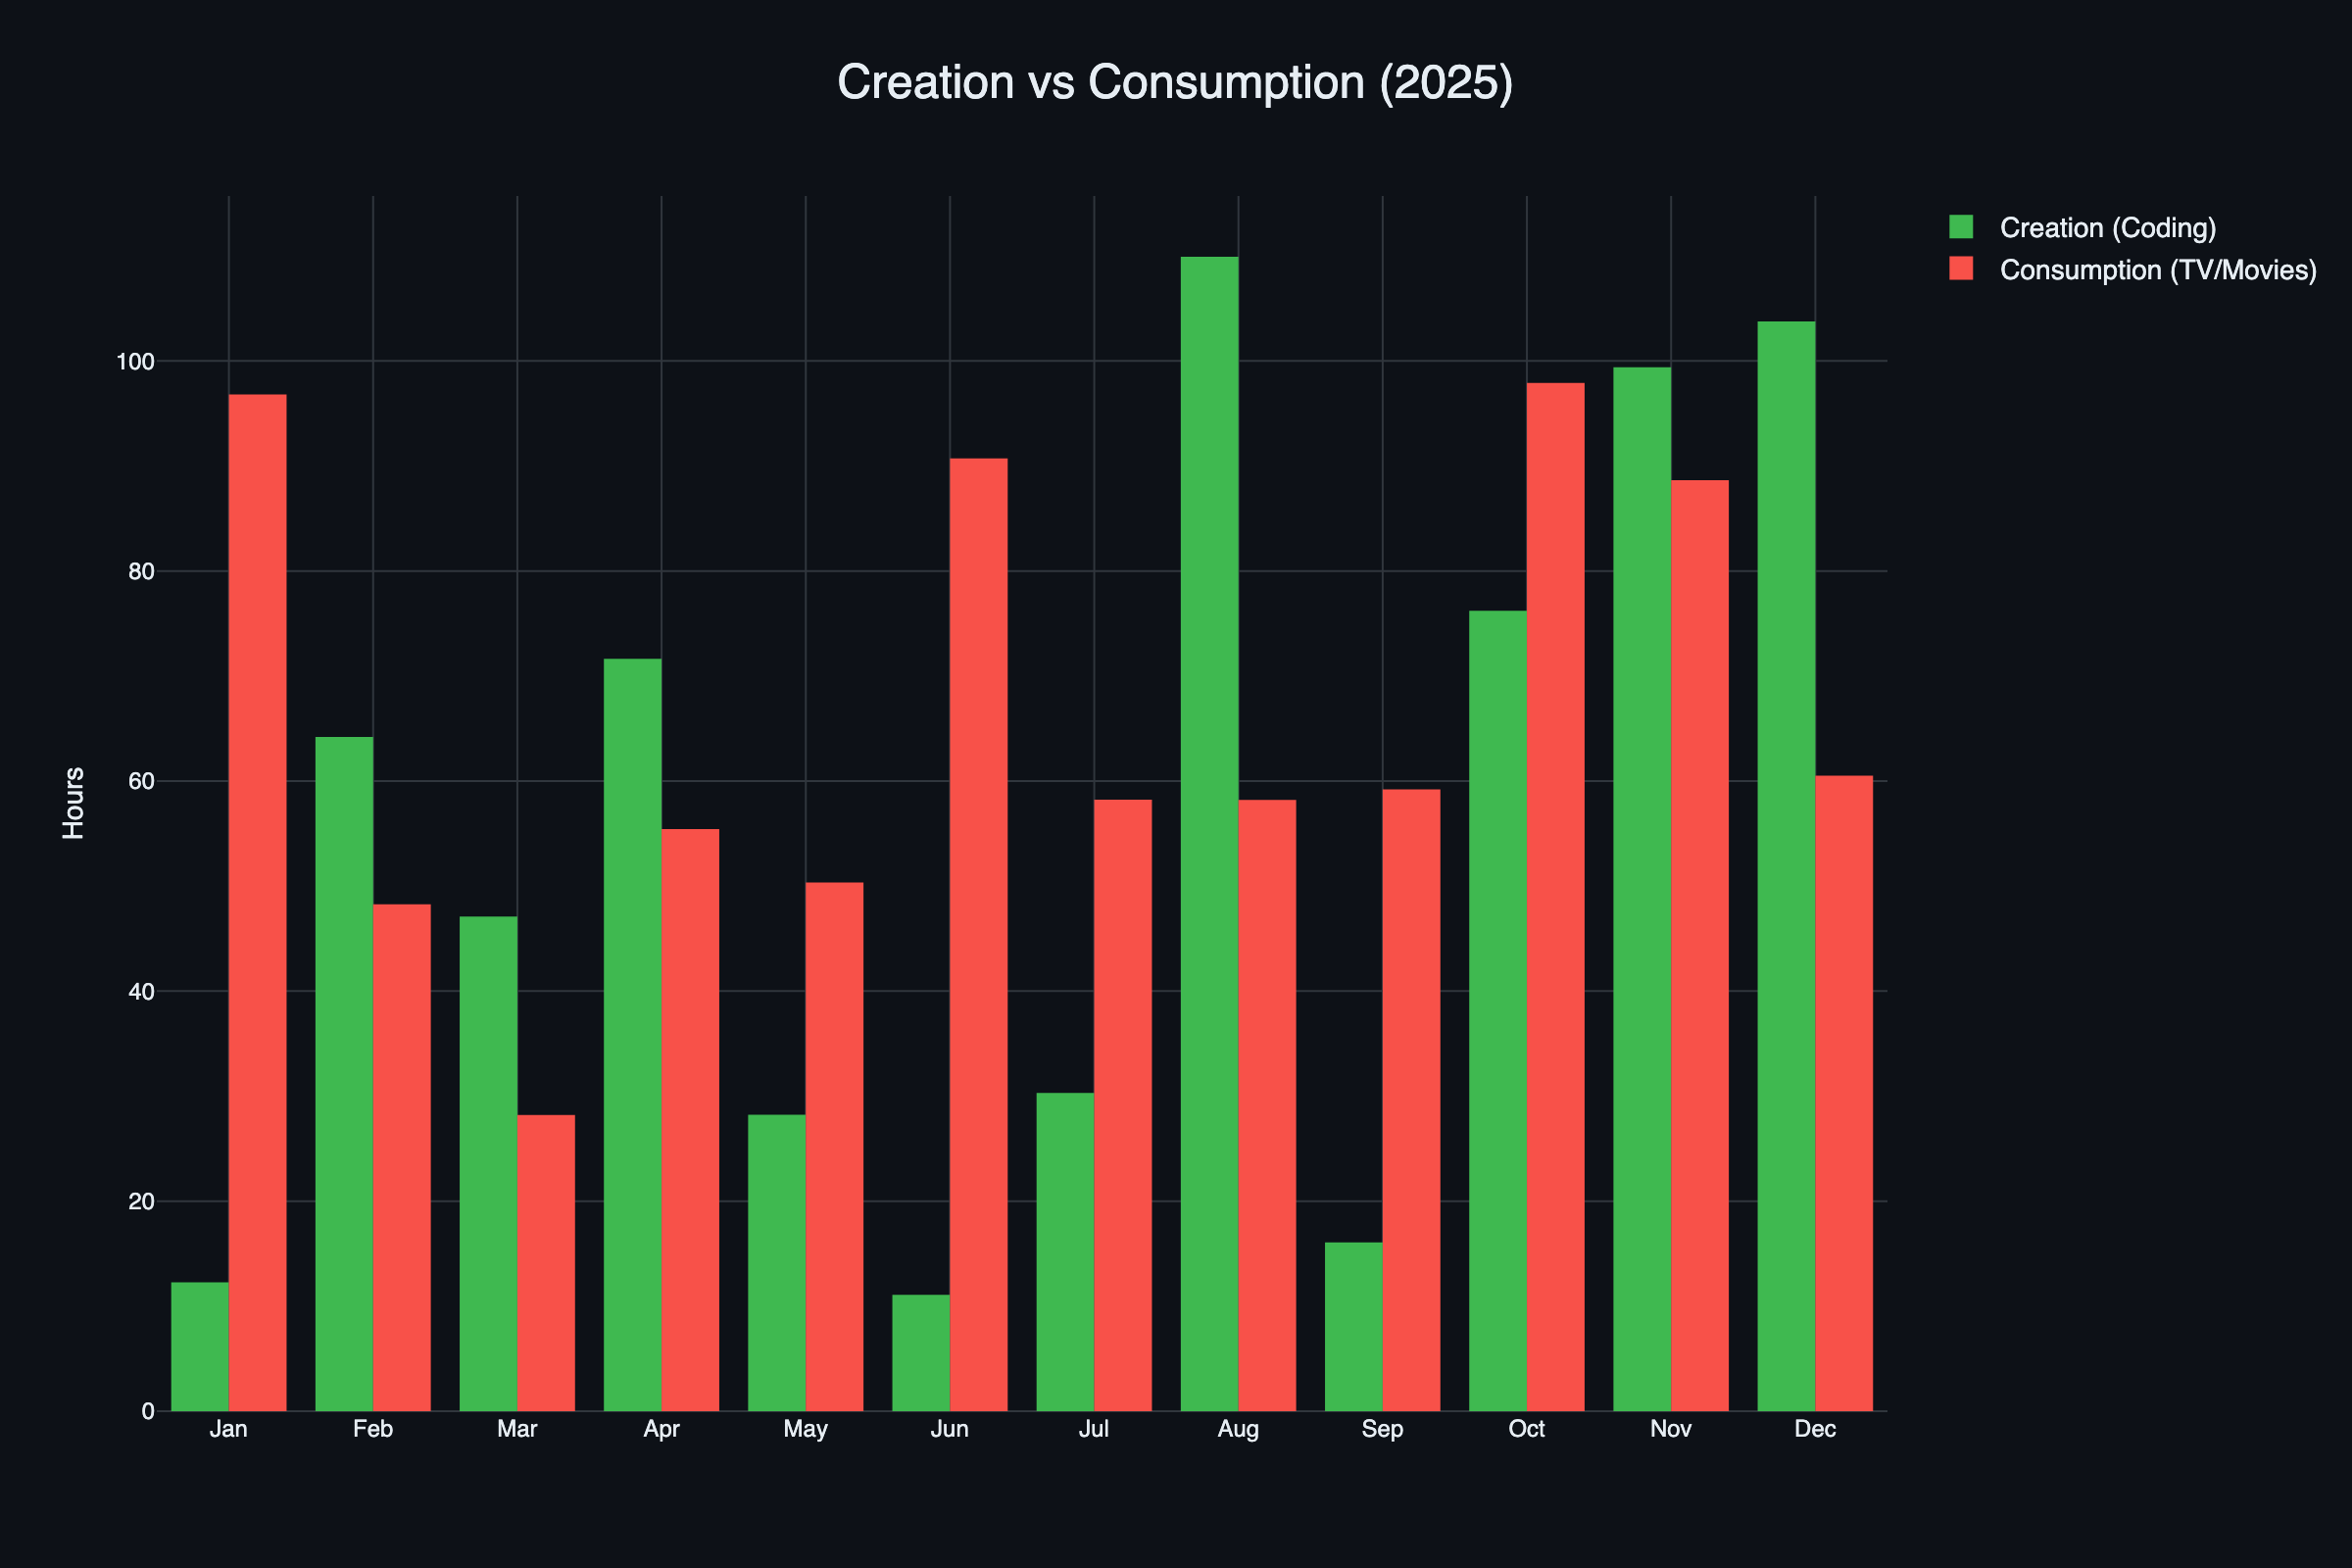
Obviously, the vacation months like January and July are high on consumption. In December, though a vacation month, there was a deadline to be met. And I think the same for August, another paper deadline.
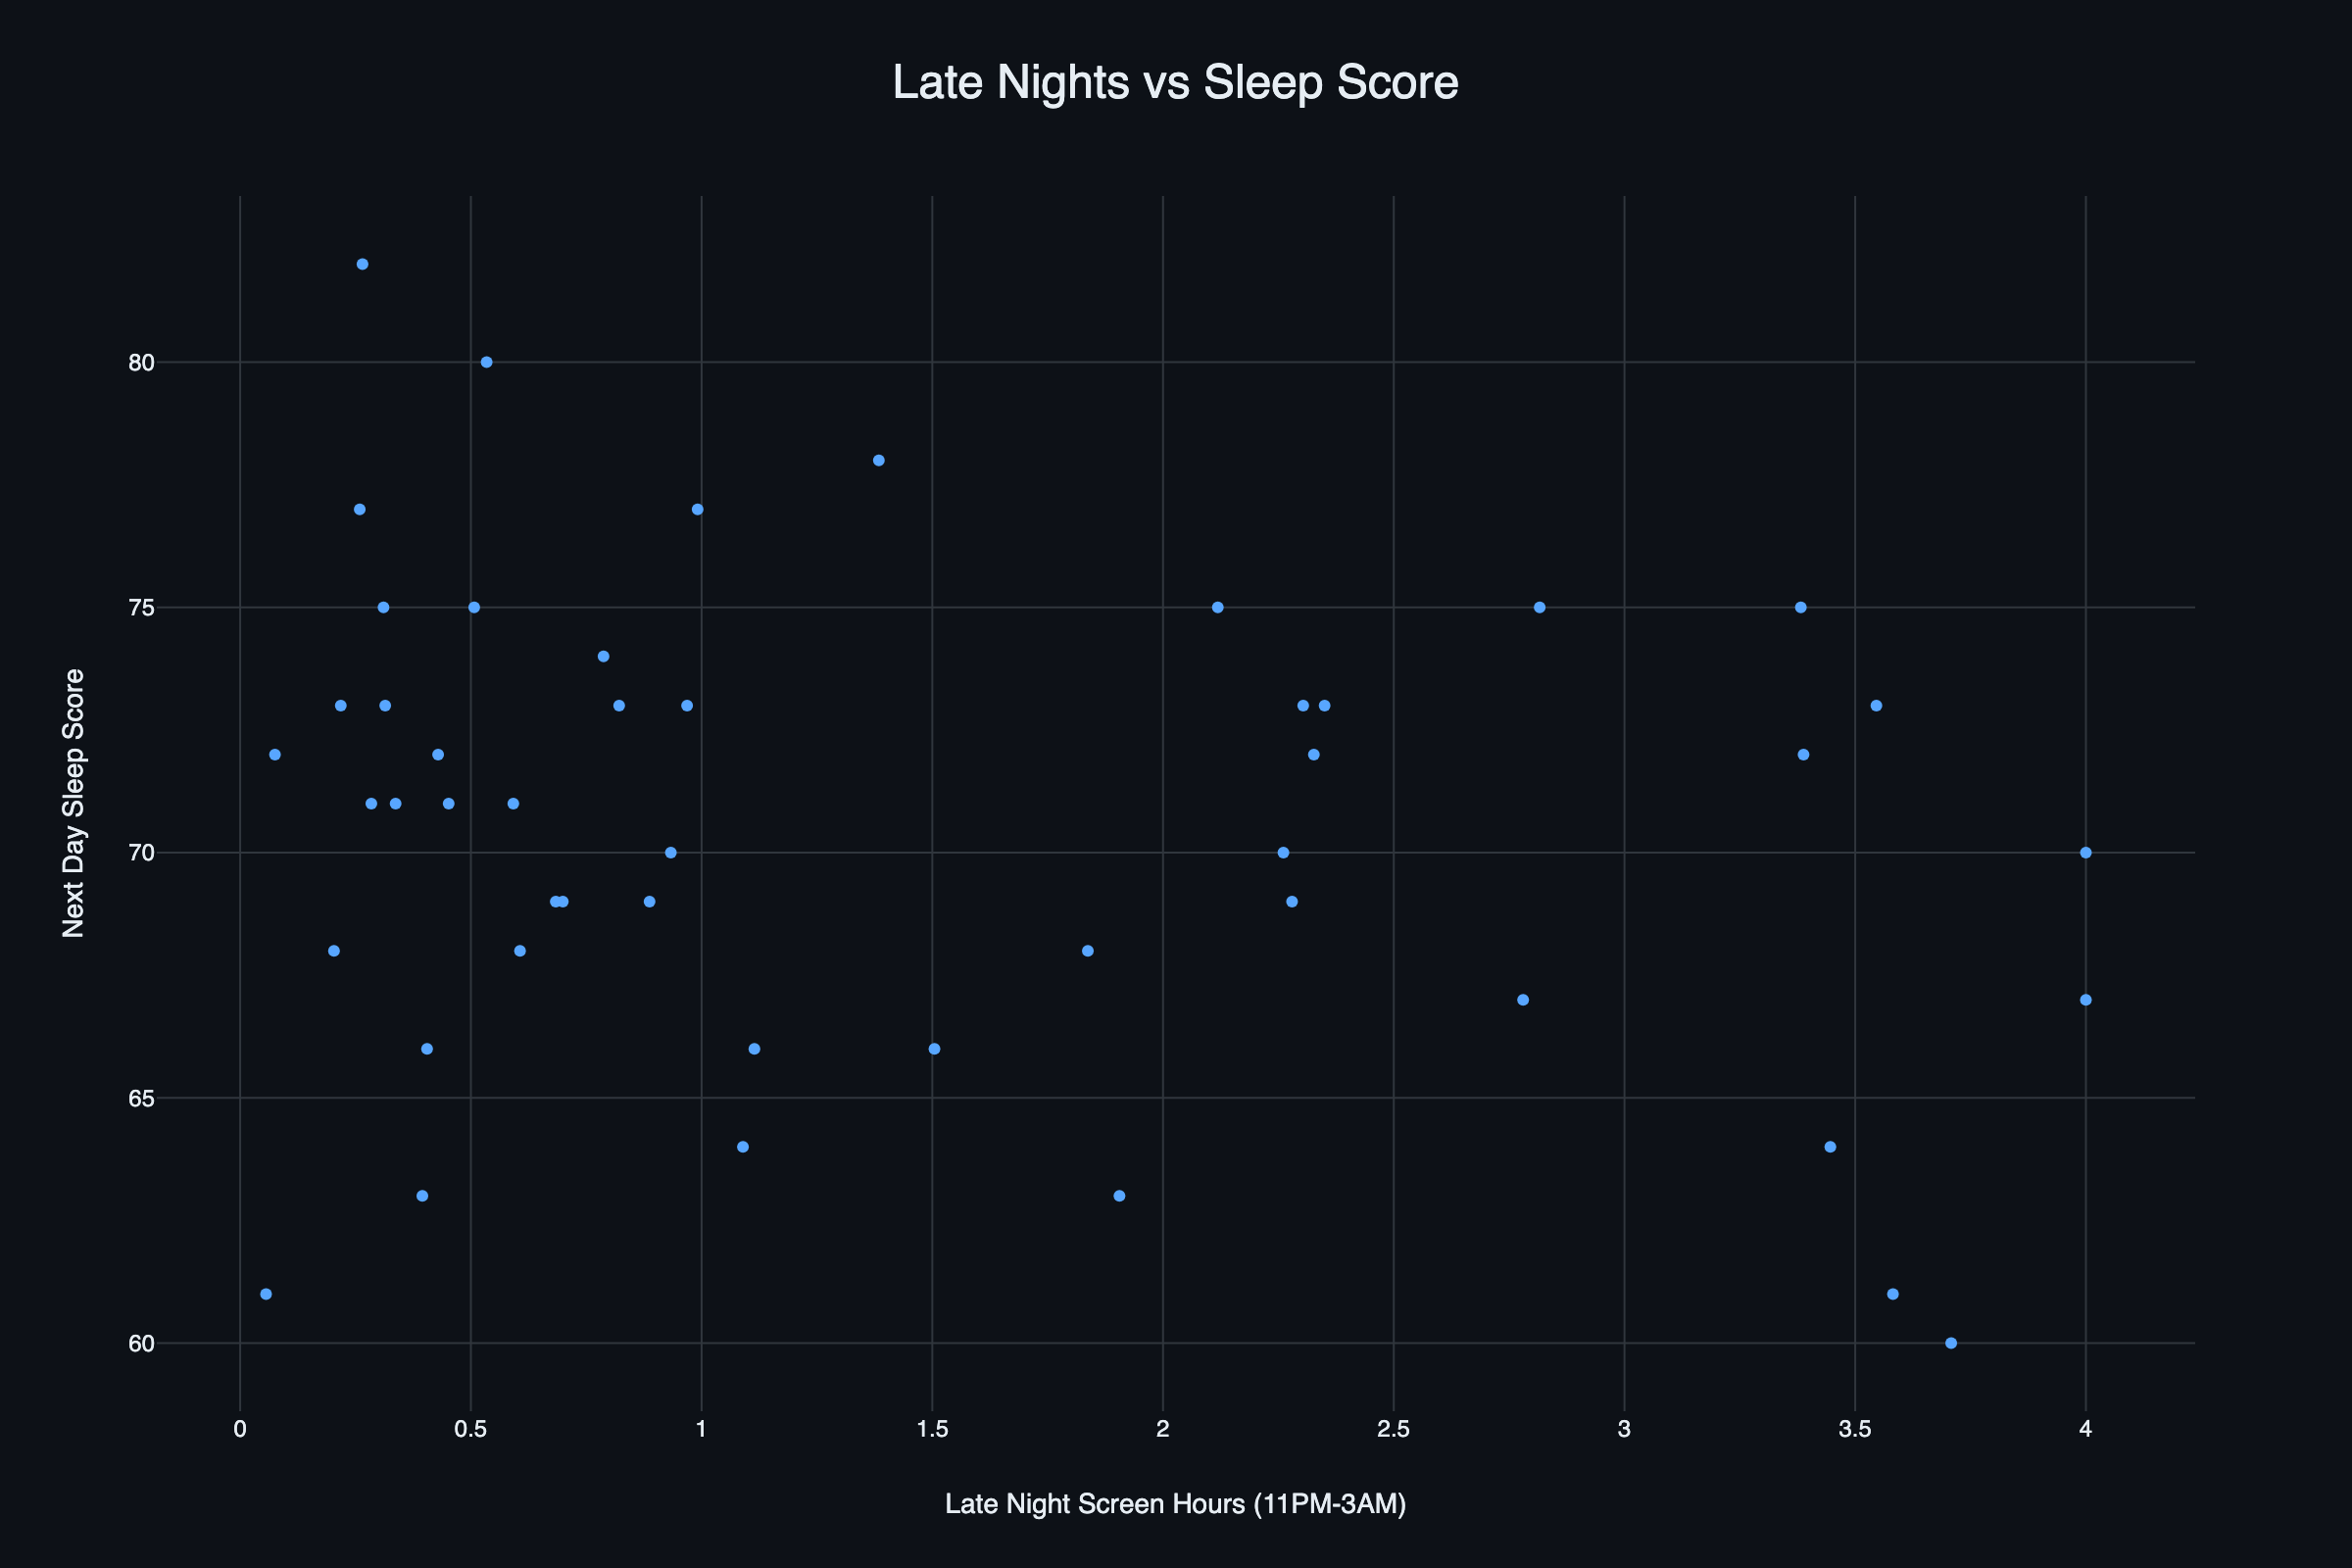
The graph below was totally generated by Gemini and I actually really like it. Though it tells you an obvious story, if I work less late at night, meaning I go to bed early (ish), then I get better sleep, it’s obvious, and everyone kind of knows this about themselves, but seeing it on a graph with the actual data is nice. Also, seeing that there are certain days or outliers where working until 1AM didn’t really affect the sleep score that much.
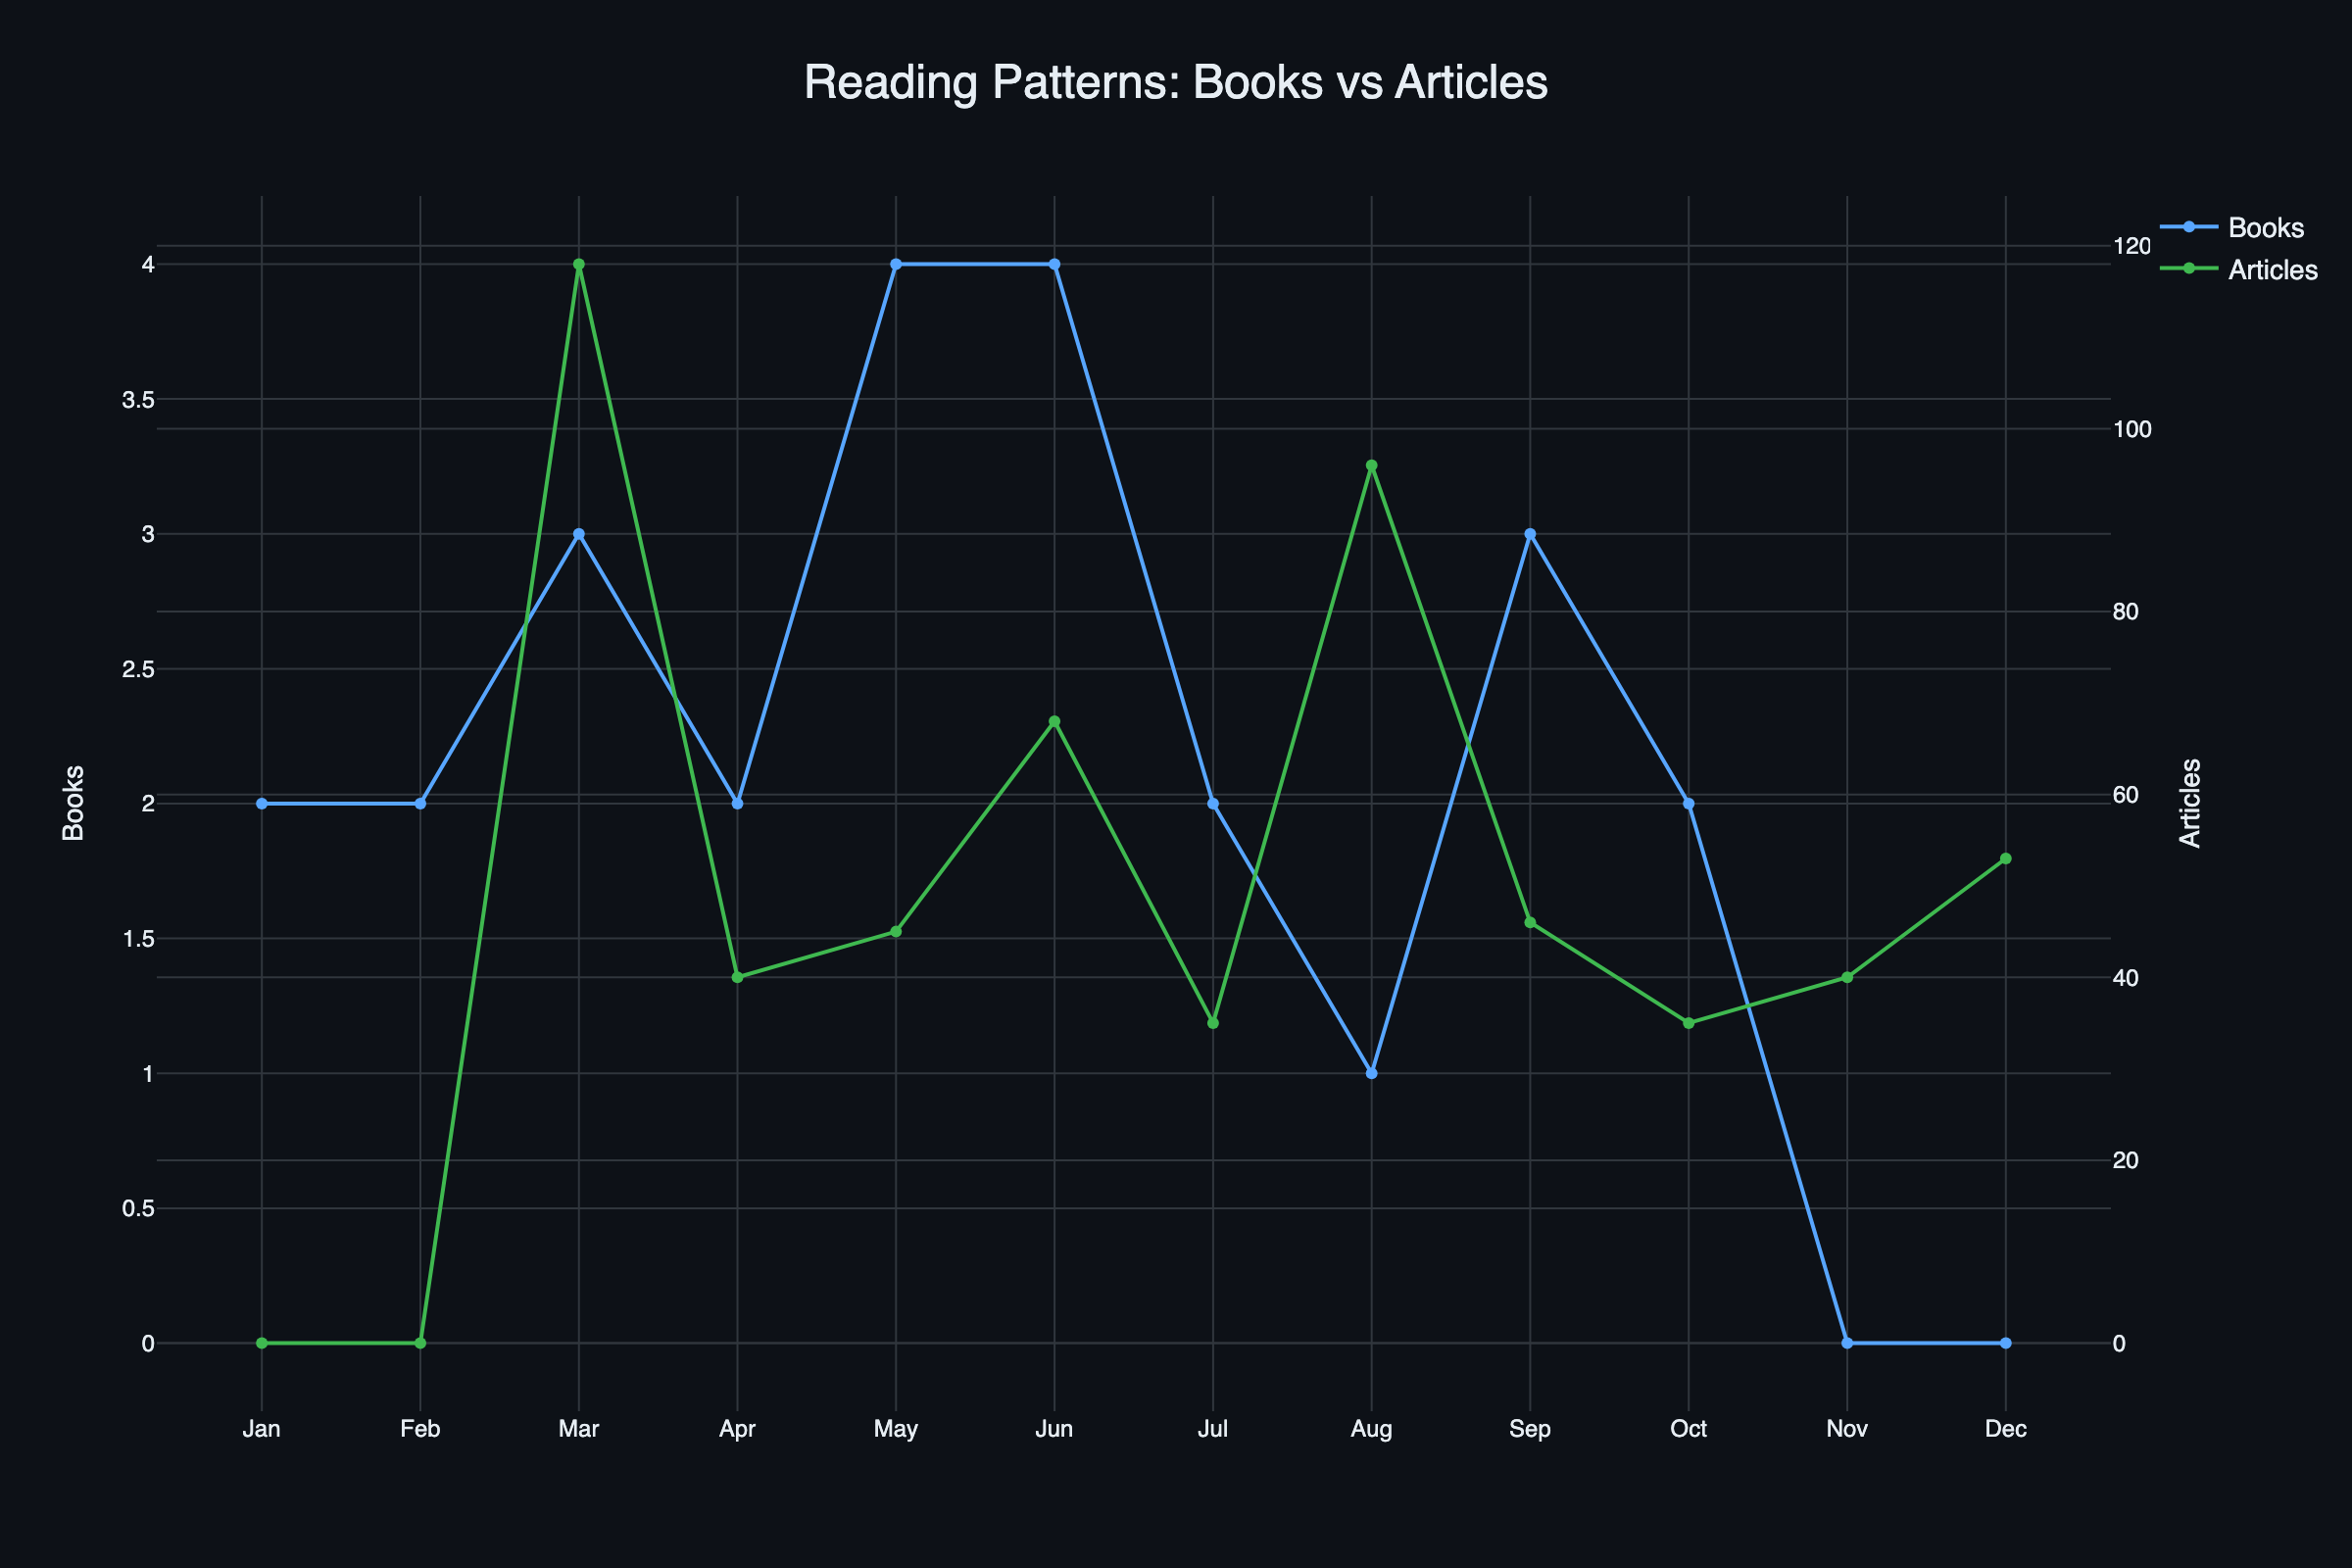
And finally the reading pattern, again obvious that the months I was reading novels, the article reading was low, and vice versa.
Year Wrap
Nothing explosive happened this year; in a way, it’s good; another way, maybe it’s bad? I mean, yeah, there were some unfortunate events that happened this year, but that’s what it is, life.
Anyways, some positive highlights:
- Got to do 2 international trips and one of them with the whole gang, so really happy about that.
- Got my first-ever critical bug report.
- It’s surprising that until 2024, the highest severity I ever reported was “High”.
- I got my first in April and then my 5th critical in November A “critical” year for me :).
- Found my first valid High Web3 bug.
- Got my biggest single bounty ever.
- I’m officially an author on a paper - https://arxiv.org/pdf/2511.17330
Looking back, surprisingly big year for bug bounties, I guess. It was fun, I’d say. There were so many frustrating 9.1 -> 3.9 severity rating drops, but as we can infer from the above highlights, there were quite a lot of positives too.
So all in all, this was a pretty good year.